Abercrombie & Fitch 1998 Annual Report Download - page 9
Download and view the complete annual report
Please find page 9 of the 1998 Abercrombie & Fitch annual report below. You can navigate through the pages in the report by either clicking on the pages listed below, or by using the keyword search tool below to find specific information within the annual report.-
 1
1 -
 2
2 -
 3
3 -
 4
4 -
 5
5 -
 6
6 -
 7
7 -
 8
8 -
 9
9 -
 10
10 -
 11
11 -
 12
12 -
 13
13 -
 14
14 -
 15
15 -
 16
16 -
 17
17 -
 18
18 -
 19
19 -
 20
20 -
21
-
22
-
23
-
24
-
25
-
26
 |
 |

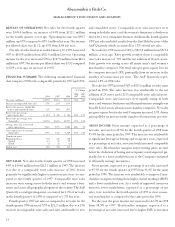
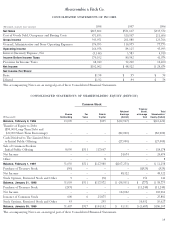
merchandise categories and a lower markdown rate. In addition,
buying and occupancy costs, expressed as a percentage of net
sales, declined due to leverage achieved from comparable store
sales increases.
In 1997, the gross income rate increased to 38.5% from 36.9%
in 1996. The improvement was the result of higher merchandise
margins, expressed as a percentage of net sales. Improved IMU,
in both the men’s and women’s businesses, drove the increase in
merchandise margins. In addition, buying and occupancy costs,
expressed as a percentage of net sales, declined slightly due to lever-
age achieved from comparable store sales increases.
GENERAL, ADMINISTRATIVE AND STORE OPERATING
EXPENSES General, administrative and store operating
expenses, expressed as a percentage of net sales, were 16.9%
in the fourth quarter of 1998 and 17.5% in the comparable
period in 1997. The improvement resulted primarily from
favorable leveraging of expenses due to higher sales volume.
Included in these expenses was approximately $2.6 million in
the fourth quarter of 1998 and 1997 of compensation expense
associated with restricted stock grants awarded to key execu-
tives of the Company.
General, administrative and store operating expenses for
the year, expressed as a percentage of net sales, were 21.7%,
22.4% and 23.2% in 1998, 1997 and 1996. The improvement
during the three-year period resulted from management’s
continued emphasis on expense control and favorable leverag-
ing of expenses, primarily store expenses, due to higher sales
volume. The 1998 improvement was offset by compensation
expense associated with restricted stock grants of approxi-
mately $11.5 million.
OPERATING INCOME Operating income, expressed as a per-
centage of net sales, was 32.4%, 27.9% and 25.4% for the fourth
quarter of 1998, 1997 and 1996 and 20.5%, 16.1% and 13.7% for
fiscal years 1998, 1997 and 1996. The improvement was the
result of higher gross income coupled with lower general, admin-
istrative and store operating expenses, expressed as a percentage
of net sales. Sales volume and gross income have increased at a
faster rate than general, administrative and store operating
expenses as the Company continues to emphasize cost controls.
15
Abercrombie &Fitch Co.
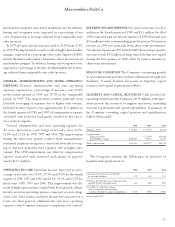
INTEREST INCOME/EXPENSE Net interest income was $1.6
million in the fourth quarter of 1998 and $3.1 million for all of
1998 compared with net interest expense of $305 thousand and
$3.6 million for the corresponding periods last year. Net interest
income in 1998 was primarily from short-term investments.
Net interest expense in 1997 included $975 thousand per quarter
associated with $50 million of long-term debt that was repaid
during the first quarter of 1998, offset by interest income on
short-term investments.
FINANCIAL CONDITION The Company’s continuing growth
in operating income provides evidence of financial strength and
flexibility. A more detailed discussion of liquidity, capital
resources and capital requirements follows.
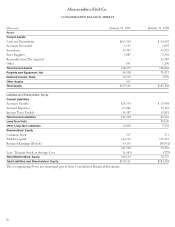
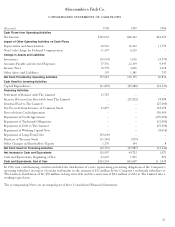
LIQUIDITY AND CAPITAL RESOURCES Cash provided by
operating activities and the Company’s $150 million credit agree-
ment provide the resources to support operations, including
seasonal requirements and capital expenditures. A summary of
the Company’s working capital position and capitalization
follows (thousands):
1998 1997 1996
Working capital $096,007 $042,000 $1,288
Capitalization:
Long-term debt – $050,000 $50,000
Shareholders’ equity $186,105 58,775 11,238
Total capitalization $186,105 $108,775 $61,238
The Company considers the following to be measures of
liquidity and capital resources:
1998 1997 1996
Current ratio (current assets divided
by current liabilities) 1.79 1.63 1.03
Debt-to-capitalization ratio (long-term debt
divided by total capitalization) n/a 46% 82%
Cash flow to capital investment
(net cash provided by operating
activities divided by capital expenditures) 413% 340% 193%
n/a=not applicable