Abercrombie & Fitch 1998 Annual Report Download - page 8
Download and view the complete annual report
Please find page 8 of the 1998 Abercrombie & Fitch annual report below. You can navigate through the pages in the report by either clicking on the pages listed below, or by using the keyword search tool below to find specific information within the annual report.-
 1
1 -
 2
2 -
 3
3 -
 4
4 -
 5
5 -
 6
6 -
 7
7 -
 8
8 -
 9
9 -
 10
10 -
 11
11 -
 12
12 -
 13
13 -
 14
14 -
 15
15 -
 16
16 -
 17
17 -
 18
18 -
 19
19 -
20
-
21
-
22
-
23
-
24
-
25
-
26
 |
 |
and remodeled stores. Comparable store sales increases were
strong in both the men’s and the women’s businesses as both were
driven by a very strong knit business. Additionally, fourth quarter
1997 net sales included results from the first Holiday issue of the
A&F Quarterly which accounted for 1.7% of total net sales.
Net sales for 1998 increased 56% to $815.8 million from $521.6
million a year ago. Sales growth resulted from a comparable
store sales increase of 35% and the net addition of 40 new stores.
Sales growth was strong across all major men’s and women’s
merchandise categories. Net retail sales per gross square foot for
the company increased 28%, principally from an increase in the
number of transactions per store. The A&F Quarterly repre-
sented 1.8% of 1998 sales.
Net sales for 1997 increased 56% to $521.6 million over the same
period in 1996. The sales increase was attributable to the net
addition of 29 stores and a 21% comparable store sales increase.
Comparable store sales increases were equally strong in both
men’s and women’s businesses and their performance strength was
broadly based across all major merchandise categories. Net sales
per gross square foot for the total Company increased 23%, driven
principally by an increase in the number of transactions per store.
GROSS INCOME Gross income, expressed as a percentage of
net sales, increased to 49.3% for the fourth quarter of 1998 from
45.4% for the same period in 1997. The increase was attributable
to significant leverage in buying and occupancy costs, expressed
as a percentage of net sales, associated with increased comparable
store sales. Merchandise margins (representing gross income
before the deduction of buying and occupancy costs) improved pri-
marily due to a lower markdown rate as the Company continued
to efficiently manage inventories.
Gross income, expressed as a percentage of net sales, increased
to 45.4% for the fourth quarter of 1997 from 43.0% for the same
period in 1996. The increase was attributable to improved mer-
chandise margins resulting from higher initial markups (IMU)
and a lower markdown rate. As a result of improved inventory
turnover, fewer markdowns, expressed as a percentage of net
sales, were needed in the fourth quarter of 1997 to clear season-
end merchandise as compared to the same period in 1996.
For the year, the gross income rate increased to 42.2% in 1998
from 38.5% in 1997. Merchandise margins, expressed as a
percentage of net sales, increased due to higher IMU across most
RESULTS OF OPERATIONS Net sales for the fourth quarter
were $304.6 million, an increase of 44% from $212.1 million
for the fourth quarter a year ago. Operating income was $98.7
million, up 67% compared to $59.1 million last year. Net income
per diluted share was $1.12, up 65% from $.68 last year.
Net sales for the fiscal year ended January 30, 1999, increased
56% to $815.8 million from $521.6 million last year. Operating
income for the year increased 99% to $167.0 million from $84.1
million in 1997. Net income per diluted share was $1.92 compared
to $.94 a year ago, an increase of 104%.
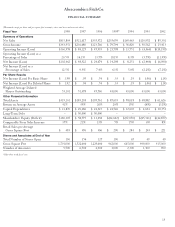
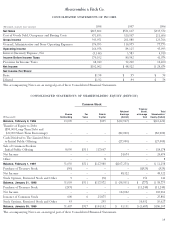
FINANCIAL SUMMARY The following summarized financial
data compares 1998 to the comparable periods for 1997 and 1996:
% Change
1998- 1997-
1998 1997 1996 1997 1996
Net sales (millions) $815.8 $521.6 $335.4 56% 56%
Increase in comparable store sales 35% 21% 13%
Retail sales increase attributable
to new and remodeled stores 21% 34% 29%
Retail sales per average
gross square foot $0,483 $0,376 $0,306 28% 23%
Retail sales per average store
(thousands) $4,551 $3,653 $2,955 25% 24%
Average store size at year-end
(gross square feet) 9,140 9,755 9,680 (6%) 1%
Gross square feet at year-end
(thousands) 1,791 1,522 1,229 18% 24%
Number of stores
Beginning of year 156 127 100
Opened 41 30 29
Closed (1) (1) (2)
End of year 196 156 127
NET SALES Net sales for the fourth quarter of 1998 increased
44% to $304.6 million from $212.1 million in 1997. The increase
was due to a comparable store sales increase of 26%, driven
primarily by significantly higher transactions per store as com-
pared to the fourth quarter of 1997. Comparable store sales
increases were strong across both the men’s and women’s busi-
nesses and across all geographical regions of the country. The A&F
Quarterly, a catalogue/magazine, accounted for 2.0% of net sales
in the fourth quarter of 1998 as compared to 1.7% last year.
Fourth quarter 1997 net sales as compared to net sales for the
fourth quarter 1996 increased 52% to $212.1 million, due to a 23%
increase in comparable store sales and sales attributable to new
14
MANAGEMENT’S DISCUSSION AND ANALYSIS
Abercrombie &Fitch Co.