3M 2015 Annual Report Download - page 88
Download and view the complete annual report
Please find page 88 of the 2015 3M annual report below. You can navigate through the pages in the report by either clicking on the pages listed below, or by using the keyword search tool below to find specific information within the annual report.-
 1
1 -
2
-
3
-
4
-
5
-
6
-
7
-
8
-
9
-
10
-
11
-
12
-
13
-
14
-
15
-
16
-
17
-
18
-
19
-
20
-
21
-
22
-
23
-
24
-
25
-
26
-
27
-
28
-
29
-
30
-
31
-
32
-
33
-
34
-
35
-
36
-
37
-
38
-
39
-
40
-
41
-
42
-
43
-
44
-
45
-
46
-
47
-
48
-
49
-
50
-
51
-
52
-
53
-
54
-
55
-
56
-
57
-
58
-
59
-
60
-
61
-
62
-
63
-
64
-
65
-
66
-
67
-
68
-
69
-
70
-
71
-
72
-
73
-
74
-
75
-
76
-
77
-
 78
78 -
 79
79 -
 80
80 -
 81
81 -
 82
82 -
 83
83 -
 84
84 -
 85
85 -
 86
86 -
 87
87 -
 88
88 -
 89
89 -
 90
90 -
 91
91 -
 92
92 -
 93
93 -
 94
94 -
 95
95 -
 96
96 -
 97
97 -
 98
98 -
99
-
100
-
101
-
102
-
103
-
104
-
105
-
106
-
107
-
108
-
109
-
110
-
111
-
112
-
113
-
114
-
115
-
116
-
117
-
118
-
119
-
120
-
121
-
122
-
123
-
124
-
125
-
126
-
127
-
128
-
129
-
130
-
131
-
132
-
133
-
134
-
135
-
136
-
137
-
138
-
139
-
140
-
141
-
142
-
143
-
144
-
145
-
146
-
147
-
148
-
149
-
150
-
151
-
152
-
153
-
154
-
155
-
156
-
157
-
158
 |
 |

TableofContents
U.S. Pension Plans and Postretirement Benefit Plan Assets
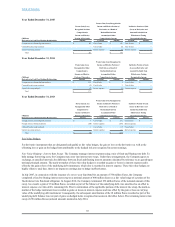
InordertoachievetheinvestmentobjectivesintheU.S.pensionplansandU.S.postretirementbenefitplans,theinvestmentpolicies
includeatargetstrategicassetallocation.Theinvestmentpoliciesallowsometolerancearoundthetargetinrecognitionthatmarket
fluctuationsandilliquidityofsomeinvestmentsmaycausetheallocationtoaspecificassetclasstovaryfromthetargetallocation,
potentiallyforlongperiodsoftime.Acceptablerangeshavebeendesignedtoallowfordeviationfromstrategictargetsandtoallow
fortheopportunityfortacticalover-andunder-weights.Theportfolioswillnormallyberebalancedwhenthequarter-endasset
allocationdeviatesfromacceptableranges.Theallocationisreviewedregularlybythenamedfiduciaryoftheplans.Approximately
39%ofthepostretirementbenefitplanassetsareina401(h)account.The401(h)accountassetsareinthesametrustastheprimary
U.S.pensionplanandinvestedwiththesameinvestmentobjectivesastheprimaryU.S.pensionplan.
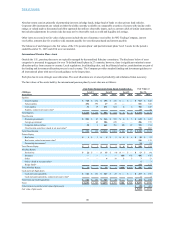
ThefairvaluesoftheassetsheldbytheU.S.pensionplansbyassetclassareasfollows:
FairValueMeasurementsUsingInputsConsideredas FairValueat
(Millions) Level1 Level2 Level3 Dec.31,
AssetClass 2015 2014 2015 2014 2015 2014 2015 2014
Equities
U.S.equities $ 1,897 $ 1,766 $ — $ — $ — $ — $ 1,897 $ 1,766
Non-U.S.equities 1,149 1,214 — — — — 1,149 1,214
Indexandlong/shortequityfunds* 578 607
TotalEquities $ 3,046 $ 2,980 $ — $ — $ — $— $ 3,624 $ 3,587
FixedIncome
U.S.governmentsecurities $ 1,095 $ 1,032 $ 456 $ 590 $ — $ — $ 1,551 $ 1,622
Non-U.S.governmentsecurities — 7 126 381 — — 126 388
Preferredandconvertiblesecurities 4 6 8 9 — — 12 15
U.S.corporatebonds 9 8 2,820 2,889 — — 2,829 2,897
Non-U.S.corporatebonds — — 616 566 — — 616 566
Derivativeinstruments (1) 6 40 126 — — 39 132
Other* 11 32
TotalFixedIncome $ 1,107 $ 1,059 $ 4,066 $ 4,561 $ — $— $ 5,184 $ 5,652
PrivateEquity
Derivativeinstruments $ — $ — $ — $ — $(106)$(74)$(106)$(74)
Growthequity 24 15 — — — — 24 15
Partnershipinvestments* 2,450 2,561
TotalPrivateEquity $ 24 $ 15 $ — $ — $(106)$(74)$ 2,368 $ 2,502
AbsoluteReturn
Derivativeinstruments $ — $ — $(5)$ — $ — $ — $(5)$ —
Fixedincomeandother 253 26 46 52 — — 299 78
Hedgefund/fundoffunds* 1,409 1,807
Partnershipinvestments* 355 288
TotalAbsoluteReturn $ 253 $ 26 $ 41 $ 52 $ — $— $ 2,058 $ 2,173
CashandCashEquivalents
Cashandcashequivalents $ 102 $ 287 $ 6 $ 86 $ — $ — $ 108 $ 373
Cashandcashequivalents,valuedatnetassetvalue* 783 531
TotalCashandCashEquivalents $ 102 $ 287 $ 6 $ 86 $ — $ — $ 891 $ 904
Total $ 4,532 $ 4,367 $ 4,113 $ 4,699 $(106)$(74)$ 14,125 $ 14,818
Otheritemstoreconciletofairvalueofplanassets $(159)$(175)
Fairvalueofplanassets $ 13,966 $ 14,643
*InaccordancewithASC820-10,certaininvestmentsthataremeasuredatfairvalueusingthenetassetvalue(NAV)pershare(or
itsequivalent)asapracticalexpedienthavenotbeenclassifiedinthefairvaluehierarchy.TheNAVisbasedonthefairvalueofthe
underlyingassetsownedbythefund,minusitsliabilitiesthendividedbythenumberofunitsoutstandingandisdeterminedbythe
investmentmanagerorcustodianofthefund.Thefairvalueamountspresentedinthistableareintendedtopermitreconciliationof
thefairvaluehierarchytotheamountspresentedinthefairvalueofplanassets.
88