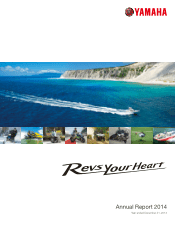
Yamaha 2014 Annual Report Download - page 9
Download and view the complete annual report
Please find page 9 of the 2014 Yamaha annual report below. You can navigate through the pages in the report by either clicking on the pages listed below, or by using the keyword search tool below to find specific information within the annual report.-
 1
1 -
 2
2 -
 3
3 -
 4
4 -
 5
5 -
 6
6 -
 7
7 -
 8
8 -
 9
9 -
 10
10 -
 11
11 -
 12
12 -
 13
13 -
 14
14 -
 15
15 -
 16
16 -
 17
17 -
 18
18 -
 19
19 -
 20
20 -
21
-
22
-
23
-
24
-
25
-
26
-
27
-
28
-
29
-
30
-
31
-
32
-
33
-
34
-
35
-
36
-
37
-
38
-
39
-
40
-
41
-
42
-
43
-
44
-
45
-
46
-
47
-
48
-
49
 |
 |

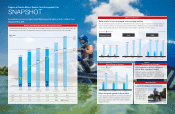
By reinforcing its business strategies, Yamaha Motor reached the targets set under its Medium-Term
Management Plan (MTP).
Sales and profit grew in all segments, on sales growth from an expanded product lineup and increased sales of higher-priced products. We
are forecasting continued growth in consolidated sales and profit in all segments again in 2015, the final year of the current MTP.
Medium-Term Management Plan: Management Targets
Unit sales in developed markets rose in 2014, as total demand bottomed out and new products were launched. In emerging markets, unit
sales rose in India on an increase in total demand and new product introductions. ASEAN markets saw a decline in unit sales, however,
owing to a drop in total demand ahead of new product launches. This resulted in a slight decline in overall unit sales.
Solid results in both developed and emerging markets
Progress was made in expanding the customer base and shifting the
business model toward higher profitability by leveraging Yamaha’s
brand strength, including its comprehensive business capabilities,
reliability and network.
Sales and profi t growth in fi scal 2014
Marine Products Business
81
35
86 89
37
35
(Ten thousand units)
Total demand Yamaha Motor
2013 20152014
New Launches
Cost Reduction Strategies
Cost reductions of ¥14.4 billion in
fi scal 2014 surpassed target
Cost reductions during fiscal 2014 totaled ¥14.4 billion,
surpassing our target of ¥10.0 billion. We will continue to reduce
costs during fiscal 2015, to achieve the targets set in the MTP.
2017
Ultimate
target
2014
Target
Net sales
Operating income
margin
Operating income
(Billion ¥) 2,000.0
1,410.5
3.9%
7.1%
7.5%
2012
Result
$80/€103
2013
Result
$98/€130
2015
Target*
$115/€130
2017
Ultimate
target
1,207.7
18.6 55.1
1,521.2
2014
Result
$106/€140
87.2
ROE 2.5% 12.7% 11.2% 16.2% 15.5% 15%
ROA 0.8% 4.2% 3.8% 5.6% 5.8% 5%
EPS ¥21 ¥126 ¥129 ¥196 ¥218 ¥200 or more
5.7%
5.0%
1,700.0
2014
Target*
$100/€135
*As of Feb. 12, 2014 *As of Feb. 12, 2015
1,500.0
1.5%
Progress of Yamaha Motor’s Medium-Term Management Plan
SNAPSHOT
Motorcycle Business
India ASEANDeveloped markets
(Ten thousand units)
Total demand Yamaha Motor
2013 20152014
1,254 1,209 1,211
342
324
361
2013 20152014
1,434
1,600 1,700
72
57
46
2013 20152014
274 261 266
44
41
37
Of the 250 new products
scheduled for release
by 2015, 63% were
launched during 2013–
2014, and we expect to
reach 100% in 2015.
Launched unique, new products
15
Yamaha Motor Co., Ltd. Annual Report 2014
14 Yamaha Motor Co., Ltd. Annual Report 2014