Xcel Energy 2005 Annual Report Download - page 62
Download and view the complete annual report
Please find page 62 of the 2005 Xcel Energy annual report below. You can navigate through the pages in the report by either clicking on the pages listed below, or by using the keyword search tool below to find specific information within the annual report.-
 1
1 -
2
-
3
-
4
-
5
-
6
-
7
-
8
-
9
-
10
-
11
-
12
-
13
-
14
-
15
-
16
-
17
-
18
-
19
-
20
-
21
-
22
-
23
-
24
-
25
-
26
-
27
-
28
-
29
-
30
-
31
-
32
-
33
-
34
-
35
-
36
-
37
-
38
-
39
-
40
-
41
-
42
-
43
-
44
-
45
-
46
-
47
-
48
-
49
-
50
-
51
-
 52
52 -
 53
53 -
 54
54 -
 55
55 -
 56
56 -
 57
57 -
 58
58 -
 59
59 -
 60
60 -
 61
61 -
 62
62 -
 63
63 -
 64
64 -
 65
65 -
 66
66 -
 67
67 -
 68
68 -
 69
69 -
 70
70 -
 71
71 -
 72
72 -
73
-
74
-
75
-
76
-
77
-
78
-
79
-
80
-
81
-
82
-
83
-
84
-
85
-
86
-
87
-
88
 |
 |

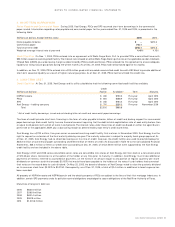
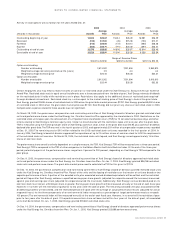
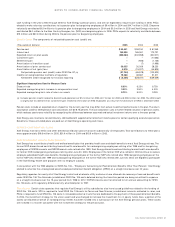
Xcel Energy bases its investment-return assumption on expected long-term performance for each of the investment types included in its pension
asset portfolio. Xcel Energy considers the actual historical returns achieved by its asset portfolio over the past 20-year or longer period, as well
as the long-term return levels projected and recommended by investment experts. The historical weighted average annual return for the past
20 years for the Xcel Energy portfolio of pension investments is 12 percent, which is greater than the current assumption level. The pension
cost determinations assume the continued current mix of investment types over the long term. The Xcel Energy portfolio is heavily weighted
toward equity securities and includes nontraditional investments that can provide a higher-than-average return. As is the experience in recent
years, a higher weighting in equity investments can increase the volatility in the return levels actually achieved by pension assets in any year.
Investment returns in 2005, 2004 and 2003 exceeded the assumed level of 8.75, 9.0 and 9.25 percent, respectively. Xcel Energy continually
reviews its pension assumptions. In 2006, Xcel Energy will continue to use an investment-return assumption of 8.75 percent.
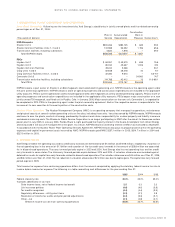
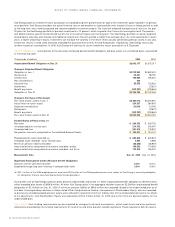
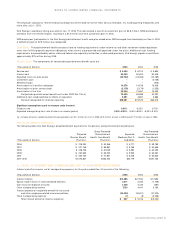
Benefit Obligations
A comparison of the actuarially computed pension-benefit obligation and plan assets, on a combined basis, is presented
in the following table:
(Thousands of dollars) 2005 2004
Accumulated Benefit Obligation at Dec. 31 $2,642,177 $2,575,317
Change in Projected Benefit Obligation
Obligation at Jan. 1 $2,732,263 $2,632,491
Service cost 60,461 58,150
Interest cost 160,985 165,361
Plan amendments 300 –
Actuarial loss 85,558 133,552
Settlements –(27,627)
Benefit payments (242,787) (229,664)
Obligation at Dec. 31 $2,796,780 $2,732,263
Change in Fair Value of Plan Assets
Fair value of plan assets at Jan. 1 $3,062,016 $3,024,661
Actual return on plan assets 254,307 284,600
Employer contributions 20,000 10,046
Settlements –(27,627)
Benefit payments (242,787) (229,664)
Fair value of plan assets at Dec. 31 $3,093,536 $3,062,016
Funded Status of Plans at Dec. 31
Net asset $ 296,756 $ 329,753
Unrecognized prior service cost 214,702 244,437
Unrecognized loss 281,519 176,957
Net pension amounts recognized on Consolidated Balance Sheets $ 792,977 $ 751,147
Prepaid pension asset recorded
(a)
$ 683,649 $ 642,873
Intangible asset recorded – prior service costs 3,563 4,689
Minimum pension liability recorded (88,280) (63,967)
Accumulated other comprehensive income recorded – pretax 198,542 170,554
Accumulated other comprehensive income recorded – net of tax 123,279 106,007
Measurement Date Dec. 31, 2005 Dec. 31, 2004
Significant Assumptions Used to Measure Benefit Obligations
Discount rate for year-end valuation 5.75% 6.00%
Expected average long-term increase in compensation level 3.50% 3.50%
(a) $22.1 million of the 2005 prepaid pension asset and $23.9 million of the 2004 prepaid pension asset relates to Xcel Energy’s remaining obligation
for companies that are now classified as discontinued operations.
During 2002, one of Xcel Energy’s pension plans became underfunded, and at Dec. 31, 2005, had projected benefit obligations of $739.5 million,
which exceeded plan assets of $609.8 million. All other Xcel Energy plans in the aggregate had plan assets of $2.5 billion and projected benefit
obligations of $2.1 billion on Dec. 31, 2005. A minimum pension liability of $88.3 million was recorded related to the underfunded plan as of
that date. A corresponding reduction in Accumulated Other Comprehensive Income, a component of Stockholders’ Equity, also was recorded,
as previously recorded prepaid pension assets were reduced to record the minimum liability. Net of the related deferred income tax effects
of the adjustments, total Stockholders’ Equity was reduced by $123.3 million at Dec. 31, 2005, due to the minimum pension liability for the
underfunded plan.
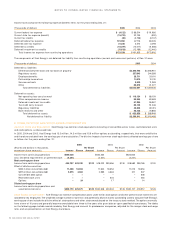
Cash Flows
Cash funding requirements can be impacted by changes to actuarial assumptions, actual asset levels and other pertinent
calculations prescribed by the funding requirements of income tax and other pension-related regulations. These regulations did not require
60 XCEL ENERGY 2005 ANNUAL REPORT
NOTES TO CONSOLIDATED FINANCIAL STATEMENTS