Xcel Energy 2005 Annual Report Download - page 46
Download and view the complete annual report
Please find page 46 of the 2005 Xcel Energy annual report below. You can navigate through the pages in the report by either clicking on the pages listed below, or by using the keyword search tool below to find specific information within the annual report.-
 1
1 -
2
-
3
-
4
-
5
-
6
-
7
-
8
-
9
-
10
-
11
-
12
-
13
-
14
-
15
-
16
-
17
-
18
-
19
-
20
-
21
-
22
-
23
-
24
-
25
-
26
-
27
-
28
-
29
-
30
-
31
-
32
-
33
-
34
-
35
-
 36
36 -
 37
37 -
 38
38 -
 39
39 -
 40
40 -
 41
41 -
 42
42 -
 43
43 -
 44
44 -
 45
45 -
 46
46 -
 47
47 -
 48
48 -
 49
49 -
 50
50 -
 51
51 -
 52
52 -
 53
53 -
 54
54 -
 55
55 -
 56
56 -
57
-
58
-
59
-
60
-
61
-
62
-
63
-
64
-
65
-
66
-
67
-
68
-
69
-
70
-
71
-
72
-
73
-
74
-
75
-
76
-
77
-
78
-
79
-
80
-
81
-
82
-
83
-
84
-
85
-
86
-
87
-
88
 |
 |

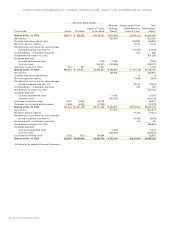
Common Stock Issued Retained Accumulated Other Total
Capital in Excess Earnings Comprehensive Stockholders’
(Thousands) Shares Par Value of Par Value (Deficit) Income (Loss) Equity
Balance at Dec. 31, 2002 398,714 $ 996,785 $4,038,151 $(100,942) $(269,010) $4,664,984
Net income 622,392 622,392
Currency translation adjustments 182,829 182,829
Minimum pension liability 9,710 9,710
Net derivative instrument fair value changes
during the period (see Note 12) (14,005) (14,005)
Unrealized gain – marketable securities 340 340
Comprehensive income for 2003 801,266
Dividends declared:
Cumulative preferred stock (720) (3,181) (3,901)
Common stock (149,521) (149,606) (299,127)
Issuances of common stock 251 627 2,591 3,218
Balance at Dec. 31, 2003 398,965 $ 997,412 $3,890,501 $ 368,663 $ (90,136) $5,166,440
Net income 355,961 355,961
Currency translation adjustments (3) (3)
Minimum pension liability (7,935) (7,935)
Net derivative instrument fair value changes
during the period (see Note 12) (8,024) (8,024)
Unrealized gain – marketable securities 164 164
Comprehensive income for 2004 340,163
Dividends declared:
Cumulative preferred stock (4,241) (4,241)
Common stock (323,742) (323,742)
Issuances of common stock 3,297 8,243 48,078 56,321
Purchases for restricted stock issuance (1,800) (4,500) (27,523) (32,023)
Balance at Dec. 31, 2004 400,462 $1,001,155 $3,911,056 $ 396,641 $(105,934) $5,202,918
Net income 512,972 512,972
Minimum pension liability (17,271) (17,271)
Net derivative instrument fair value changes
during the period (see Note 12) (8,919) (8,919)
Unrealized gain – marketable securities 63 63
Comprehensive income for 2005 486,845
Dividends declared:
Cumulative preferred stock (4,241) (4,241)
Common stock (343,234) (343,234)
Issuances of common stock 2,925 7,313 45,654 52,967
Balance at Dec. 31, 2005 403,387 $1,008,468 $3,956,710 $ 562,138 $(132,061) $5,395,255
See Notes to Consolidated Financial Statements.
44 XCEL ENERGY 2005 ANNUAL REPORT
CONSOLIDATED STATEM ENTS OF COMM ON STOCKHOLDERS’EQUITY AND COMPREHENSIVE INCOME