Xcel Energy 2005 Annual Report Download - page 58
Download and view the complete annual report
Please find page 58 of the 2005 Xcel Energy annual report below. You can navigate through the pages in the report by either clicking on the pages listed below, or by using the keyword search tool below to find specific information within the annual report.-
 1
1 -
2
-
3
-
4
-
5
-
6
-
7
-
8
-
9
-
10
-
11
-
12
-
13
-
14
-
15
-
16
-
17
-
18
-
19
-
20
-
21
-
22
-
23
-
24
-
25
-
26
-
27
-
28
-
29
-
30
-
31
-
32
-
33
-
34
-
35
-
36
-
37
-
38
-
39
-
40
-
41
-
42
-
43
-
44
-
45
-
46
-
47
-
 48
48 -
 49
49 -
 50
50 -
 51
51 -
 52
52 -
 53
53 -
 54
54 -
 55
55 -
 56
56 -
 57
57 -
 58
58 -
 59
59 -
 60
60 -
 61
61 -
 62
62 -
 63
63 -
 64
64 -
 65
65 -
 66
66 -
 67
67 -
 68
68 -
69
-
70
-
71
-
72
-
73
-
74
-
75
-
76
-
77
-
78
-
79
-
80
-
81
-
82
-
83
-
84
-
85
-
86
-
87
-
88
 |
 |

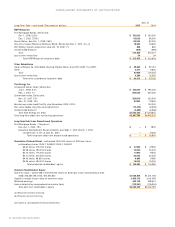
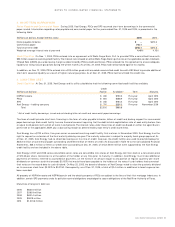
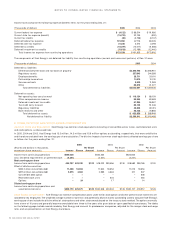
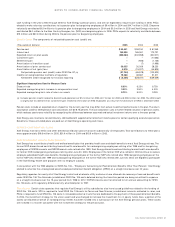
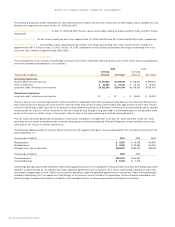
Income taxes comprise the following expense (benefit) items for the years ending Dec. 31:
(Thousands of dollars) 2005 2004 2003
Current federal tax expense $ (4,122) $ 88,514 $ 111,986
Current state tax expense (benefit) (15,733) 32,135 (592)
Current tax credits (45) (3,798) (3,137)
Deferred federal tax expense 191,900 67,716 83,245
Deferred state tax expense 31,235 3,574 3,298
Deferred tax credits (18,077) (14,017) (11,668)
Deferred investment tax credits (11,619) (12,189) (12,440)
Total income tax expense from continuing operations $173,539 $161,935 $170,692
The components of Xcel Energy’s net deferred tax liability from continuing operations (current and noncurrent portions) at Dec. 31 were:
(Thousands of dollars) 2005 2004
Deferred tax liabilities:
Differences between book and tax bases of property $2,245,748 $2,056,951
Regulatory assets 257,843 244,388
Employee benefits 25,711 33,191
Partnership income/loss 10,010 10,310
Service contracts 8,539 11,369
Other 85,810 31,227
Total deferred tax liabilities $2,633,661 $ 2,387,436
Deferred tax assets:
Net operating loss carry forward $ 119,124 $ 88,159
Other comprehensive income 80,356 63,469
Deferred investment tax credits 51,286 55,967
Tax credit carry forward 86,143 51,046
Regulatory liabilities 40,835 39,415
Book reserves and other 46,106 70,892
Total deferred tax assets $ 423,850 $ 368,948
Net deferred tax liability $2,209,811 $2,018,488
9. COMMON STOCK AND STOCK-BASED COMPENSATION
Common Stock and Equivalents
Xcel Energy has common stock equivalents consisting of convertible senior notes, restricted stock units
and stock options, as discussed later.
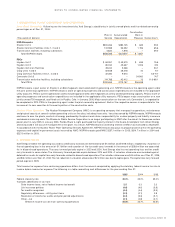
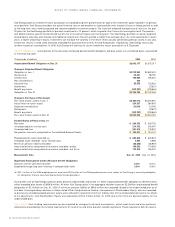
In 2005, 2004 and 2003, Xcel Energy had 13.3 million, 14.3 million and 15.6 million options outstanding, respectively, that were antidilutive
and therefore excluded from the earnings per share calculation. The dilutive impact of common stock equivalents affected earnings per share
as follows for the years ending Dec. 31:
2005 2004 2003
(Shares and dollars in thousands, Per Share Per Share Per Share
except per share amounts) Income Shares Amount Income Shares Amount Income Shares Amount
Income from continuing operations $499,038 $522,264 $522,824
Less: Dividend requirements on preferred stock (4,241) (4,241) (4,241)
Basic earnings per share
Income from continuing operations 494,797 402,330 $1.23 518,023 399,456 $1.30 518,583 398,765 $1.30
Effect of dilutive securities:
$230 million convertible debt 11,498 18,654 11,940 18,654 11,213 18,654
$57.5 million convertible debt 2,875 4,663 2,985 4,663 311 507
Convertible debt option –– – – – 508
Restricted stock units –– – 544 – 464
Options –24 –17 –14
Diluted earnings per share
Income from continuing operations and
assumed conversions $509,170 425,671 $1.20 $532,948 423,334 $1.26 $530,107 418,912 $1.26
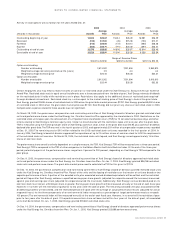
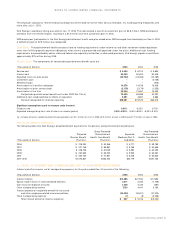
Stock-Based Compensation
Xcel Energy has incentive compensation plans under which stock options and other performance incentives are
awarded to key employees. The weighted average number of common and potentially dilutive shares outstanding used to calculate Xcel Energy’s
earnings per share include the dilutive effect of stock options and other stock awards based on the treasury stock method. The options normally
have a term of 10 years and generally become exercisable from three to five years after grant date or upon specified circumstances. Th e tables
on the following page include awards made by Xcel Energy and some of its predecessor companies, adjusted for the merger stock exchange
ratio, and are presented on an Xcel Energy share basis.
56 XCEL ENERGY 2005 ANNUAL REPORT
NOTES TO CONSOLIDATED FINANCIAL STATEMENTS