Xcel Energy 2003 Annual Report Download - page 6
Download and view the complete annual report
Please find page 6 of the 2003 Xcel Energy annual report below. You can navigate through the pages in the report by either clicking on the pages listed below, or by using the keyword search tool below to find specific information within the annual report.-
 1
1 -
 2
2 -
 3
3 -
 4
4 -
 5
5 -
 6
6 -
 7
7 -
 8
8 -
 9
9 -
 10
10 -
 11
11 -
 12
12 -
 13
13 -
 14
14 -
 15
15 -
 16
16 -
 17
17 -
18
-
19
-
20
-
21
-
22
-
23
-
24
-
25
-
26
-
27
-
28
-
29
-
30
-
31
-
32
-
33
-
34
-
35
-
36
-
37
-
38
-
39
-
40
-
41
-
42
-
43
-
44
-
45
-
46
-
47
-
48
-
49
-
50
-
51
-
52
-
53
-
54
-
55
-
56
-
57
-
58
-
59
-
60
-
61
-
62
-
63
-
64
-
65
-
66
-
67
-
68
-
69
-
70
-
71
-
72
-
73
-
74
 |
 |

22 XCEL ENERGY 2003 ANNUAL REPORT
MANAGEMENT’S DISCUSSION AND ANALYSIS
2002 Comparison to 2001 Short-term wholesale and electric commodity trading sales margins decreased an aggregate of approximately $209 million
in 2002, compared with 2001. The decrease in short-term wholesale and electric commodity trading margin reflects less favorable market conditions in
the western regions.
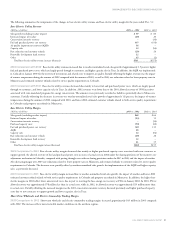
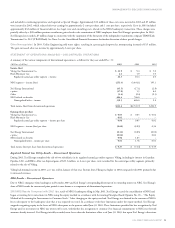
Natural Gas Utility Margins
The following table details the changes in natural gas utility revenue and margin. The cost of natural gas tends to vary with changing sales requirements
and the unit cost of wholesale natural gas purchases. However, due to purchased natural gas cost recovery mechanisms for sales to retail customers,
fluctuations in the wholesale cost of natural gas have little effect on natural gas margin.
(Millions of dollars) 2003 2002 2001
Natural gas utility revenue $1,710 $1,363 $2,023
Cost of natural gas purchased and transported (1,208) (853) (1,521)
Natural gas utility margin $502 $ 510 $ 502
The following summarizes the components of the changes in natural gas revenue and margin for the years ended Dec. 31:
Natural Gas Revenue
(Millions of dollars) 2003 vs. 2002 2002 vs. 2001
Sales growth (excluding weather impact) $15 $–
Estimated impact of weather on firm sales volume –22
Purchased natural gas adjustment clause recovery 348 (675)
Rate changes – Colorado (14) –
Transportation and other (2) (7)
Total natural gas revenue increase (decrease) $347 $(660)
2003 Comparison to 2002 Natural gas revenue increased mainly due to higher natural gas costs in 2003, which are passed through to customers.
2002 Comparison to 2001 Natural gas revenue decreased mainly due to lower natural gas costs in 2002, which are passed through to customers.
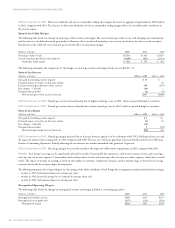
Natural Gas Margin
(Millions of dollars) 2003 vs. 2002 2002 vs. 2001
Sales growth (excluding weather impact) $ 5 $ –
Estimated impact of weather on firm sales volume (4) 18
Rate changes – Colorado (14) –
Transportation and other 5(10)
Total natural gas margin increase (decrease) $(8) $ 8
2003 Comparison to 2002 Natural gas margin decreased due to base rate decreases agreed to in the settlement of the PSCo 2002 general rate case and
the impact of warmer winter temperatures in 2003 compared with 2002. The rate case settlement agreement is discussed further under Factors Affecting
Results of Continuing Operations. Partially offsetting the rate decrease was weather-normalized sales growth of 1.6 percent.
2002 Comparison to 2001 Natural gas margin increased due mainly to the impact of colder winter temperatures in 2002 compared with 2001.
Weather Xcel Energy’s earnings can be significantly affected by weather. Unseasonably hot summers or cold winters increase electric and natural gas
sales, but also can increase expenses. Unseasonably mild weather reduces electric and natural gas sales, but may not reduce expenses, which affects overall
results. The impact of weather on earnings is based on the number of customers, temperature variances and the amount of gas or electricity the average
customer historically has used per degree of temperature.
The following summarizes the estimated impact on the earnings of the utility subsidiaries of Xcel Energy due to temperature variations from historical averages:
–weather in 2003 had minimal impact on earnings per share;
–weather in 2002 increased earnings by an estimated 6 cents per share; and
–weather in 2001 had minimal impact on earnings per share.
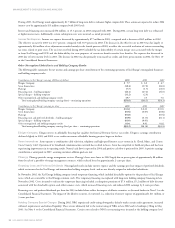
Nonregulated Operating Margins
The following table details the changes in nonregulated revenue and margin included in continuing operations:
(Millions of dollars) 2003 2002 2001
Nonregulated and other revenue $258 $235 $237
Nonregulated cost of goods sold (157) (133) (128)
Nonregulated margin $101 $102 $109