Xcel Energy 2003 Annual Report Download - page 3
Download and view the complete annual report
Please find page 3 of the 2003 Xcel Energy annual report below. You can navigate through the pages in the report by either clicking on the pages listed below, or by using the keyword search tool below to find specific information within the annual report.-
 1
1 -
 2
2 -
 3
3 -
 4
4 -
 5
5 -
 6
6 -
 7
7 -
 8
8 -
 9
9 -
 10
10 -
 11
11 -
 12
12 -
 13
13 -
 14
14 -
15
-
16
-
17
-
18
-
19
-
20
-
21
-
22
-
23
-
24
-
25
-
26
-
27
-
28
-
29
-
30
-
31
-
32
-
33
-
34
-
35
-
36
-
37
-
38
-
39
-
40
-
41
-
42
-
43
-
44
-
45
-
46
-
47
-
48
-
49
-
50
-
51
-
52
-
53
-
54
-
55
-
56
-
57
-
58
-
59
-
60
-
61
-
62
-
63
-
64
-
65
-
66
-
67
-
68
-
69
-
70
-
71
-
72
-
73
-
74
 |
 |

MANAGEMENT’S DISCUSSION AND ANALYSIS
XCEL ENERGY 2003 ANNUAL REPORT 19
RESULTS OF OPERATIONS
SUMMARY OF FINANCIAL RESULTS
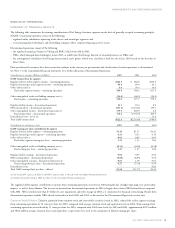
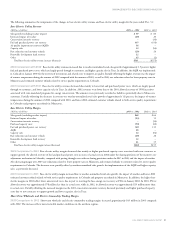
The following table summarizes the earnings contributions of Xcel Energy’s business segments on the basis of generally accepted accounting principles
(GAAP). Continuing operations consist of the following:
–regulated utility subsidiaries, operating in the electric and natural gas segments; and
–several nonregulated subsidiaries and the holding company, where corporate financing activity occurs.
Discontinued operations consist of the following:
–the regulated natural gas businesses Viking and BMG, which were sold in 2003;
–NRG, which emerged from bankruptcy in late 2003, at which time Xcel Energy divested its ownership interest in NRG; and
–the nonregulated subsidiaries Xcel Energy International and e prime, which were classified as held for sale in late 2003 based on the decision to
divest them.
Prior-year financial statements have been restated to conform to the current year presentation and classification of certain operations as discontinued.
See Note 3 to the Consolidated Financial Statements for a further discussion of discontinued operations.
Contribution to earnings (Millions of dollars) 2003 2002 2001
GAAP income (loss) by segment
Regulated electric utility segment income – continuing operations $462.5 $ 486.8 $556.0
Regulated natural gas utility segment income – continuing operations 94.9 89.0 63.1
Other utility results(a) 6.6 20.4 18.4
Total utility segment income – continuing operations 564.0 596.2 637.5
Other nonregulated results and holding company costs(a) (54.0) (68.5) (58.3)
Total income – continuing operations 510.0 527.7 579.2
Regulated utility income – discontinued operations 24.3 10.4 6.0
NRG income (loss) – discontinued operations (251.4) (3,444.1) 195.1
Other nonregulated income – discontinued operations(b) 339.5 688.0 2.8
Total income (loss) – discontinued operations 112.4 (2,745.7) 203.9
Extraordinary item – net of tax ––11.8
Total GAAP income (loss) $622.4 $(2,218.0) $794.9
Contribution to earnings per share 2003 2002 2001
GAAP earnings per share contribution by segment
Regulated electric utility segment – continuing operations $1.10 $1.27 $1.62
Regulated natural gas utility segment – continuing operations 0.23 0.23 0.19
Other utility results(a) 0.02 0.05 0.05
Total utility segment earnings per share – continuing operations 1.35 1.55 1.86
Other nonregulated results and holding company costs(a) (0.12) (0.18) (0.18)
Total earnings per share – continuing operations 1.23 1.37 1.68
Regulated utility earnings – discontinued operations 0.06 0.03 0.02
NRG earnings (loss) – discontinued operations (0.60) (8.95) 0.56
Other nonregulated earnings – discontinued operations(b) 0.81 1.78 0.01
Total earnings (loss) per share – discontinued operations 0.27 (7.14) 0.59
Extraordinary item ––0.03
Total GAAP earnings (loss) per share – diluted $1.50 $(5.77) $2.30
(a) Not a reportable segment. Included in All Other segment results in Note 20 to the Consolidated Financial Statements.
(b) Includes tax benefit related to NRG. See Note 3 to the Consolidated Financial Statements.
The regulated utility segment contribution to income from continuing operations was lower in 2003 primarily due to higher operating costs and weather
impacts, as well as share dilution. The increase in income from discontinued operations in 2003 is largely due to lower NRG-related losses compared
with 2002. NRG recorded more than $3 billion of asset impairment and other charges in 2002 as it commenced its financial restructuring. Results from
discontinued operations include NRG-related tax benefits in both 2003 and 2002, as discussed in the Discontinued Operations section later.
Common Stock Dilution Dilution, primarily from common stock and convertible securities issued in 2002, reduced the utility segment earnings
from continuing operations by 12 cents per share for 2003, compared with average common stock and equivalent levels in 2002. Total earnings from
continuing operations were reduced by 11 cents per share for 2003, compared with 2002 share levels. In 2003 and 2002, approximately 418.9 million
and 384.6 million average common shares and equivalents, respectively, were used in the calculation of diluted earnings per share.