Xcel Energy 2003 Annual Report Download - page 26
Download and view the complete annual report
Please find page 26 of the 2003 Xcel Energy annual report below. You can navigate through the pages in the report by either clicking on the pages listed below, or by using the keyword search tool below to find specific information within the annual report.-
 1
1 -
2
-
3
-
4
-
5
-
6
-
7
-
8
-
9
-
10
-
11
-
12
-
13
-
14
-
15
-
 16
16 -
 17
17 -
 18
18 -
 19
19 -
 20
20 -
 21
21 -
 22
22 -
 23
23 -
 24
24 -
 25
25 -
 26
26 -
 27
27 -
 28
28 -
 29
29 -
 30
30 -
 31
31 -
 32
32 -
 33
33 -
 34
34 -
 35
35 -
 36
36 -
37
-
38
-
39
-
40
-
41
-
42
-
43
-
44
-
45
-
46
-
47
-
48
-
49
-
50
-
51
-
52
-
53
-
54
-
55
-
56
-
57
-
58
-
59
-
60
-
61
-
62
-
63
-
64
-
65
-
66
-
67
-
68
-
69
-
70
-
71
-
72
-
73
-
74
 |
 |

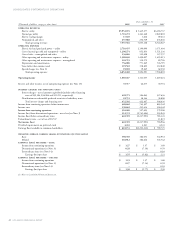
42 XCEL ENERGY 2003 ANNUAL REPORT
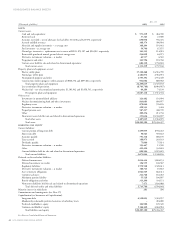
CONSOLIDATED STATEMENTS OF OPERATIONS
Year ended Dec. 31
(Thousands of dollars, except per share data) 2003 2002 2001
OPERATING REVENUES
Electric utility $5,952,191 $ 5,435,377 $6,394,737
Natural gas utility 1,710,272 1,363,360 2,022,803
Electric trading margin 17,165 1,642 69,641
Nonregulated and other 257,888 234,749 236,846
Total operating revenues 7,937,516 7,035,128 8,724,027
OPERATING EXPENSES
Electric fuel and purchased power – utility 2,710,455 2,199,099 3,171,404
Cost of natural gas sold and transported – utility 1,208,274 852,813 1,521,236
Cost of sales – nonregulated and other 156,626 132,628 127,557
Other operating and maintenance expenses – utility 1,580,630 1,490,027 1,493,015
Other operating and maintenance expenses – nonregulated 101,723 110,172 89,726
Depreciation and amortization 756,000 771,265 726,795
Taxes (other than income taxes) 319,522 318,822 312,840
Special charges (see Note 2) 19,039 19,265 62,230
Total operating expenses 6,852,269 5,894,091 7,504,803
Operating income 1,085,247 1,141,037 1,219,224
Interest and other income, net of nonoperating expenses (see Note 13) 35,717 44,677 30,754
INTEREST CHARGES AND FINANCING COSTS
Interest charges – net of amounts capitalized (includes other financing
costs of $32,184, $34,884 and $11,211, respectively) 429,571 384,063 327,636
Distributions on redeemable preferred securities of subsidiary trusts 22,731 38,344 38,800
Total interest charges and financing costs 452,302 422,407 366,436
Income from continuing operations before income taxes 668,662 763,307 883,542
Income taxes 158,642 235,614 304,342
Income from continuing operations 510,020 527,693 579,200
Income (loss) from discontinued operations – net of tax (see Note 3) 112,372 (2,745,684) 203,945
Income (loss) before extraordinary items 622,392 (2,217,991) 783,145
Extraordinary items – net of tax of $5,747 – – 11,821
Net income (loss) 622,392 (2,217,991) 794,966
Dividend requirements on preferred stock 4,241 4,241 4,241
Earnings (loss) available to common shareholders $ 618,151 $(2,222,232) $ 790,725
WEIGHTED AVERAGE COMMON SHARES OUTSTANDING (IN THOUSANDS)
Basic 398,765 382,051 342,952
Diluted 418,912 384,646 343,742
EARNINGS (LOSS) PER SHARE – BASIC
Income from continuing operations $ 1.27 $ 1.37 $ 1.69
Discontinued operations (see Note 3) 0.28 (7.19) 0.59
Extraordinary items (see Note 14) –– 0.03
Earnings (loss) per share $ 1.55 $ (5.82) $ 2.31
EARNINGS (LOSS) PER SHARE – DILUTED
Income from continuing operations $ 1.23 $ 1.37 $ 1.68
Discontinued operations (see Note 3) 0.27 (7.14) 0.59
Extraordinary items (see Note 14) –– 0.03
Earnings (loss) per share $ 1.50 $ (5.77) $ 2.30
See Notes to Consolidated Financial Statements.