Xcel Energy 2003 Annual Report Download - page 28
Download and view the complete annual report
Please find page 28 of the 2003 Xcel Energy annual report below. You can navigate through the pages in the report by either clicking on the pages listed below, or by using the keyword search tool below to find specific information within the annual report.-
 1
1 -
2
-
3
-
4
-
5
-
6
-
7
-
8
-
9
-
10
-
11
-
12
-
13
-
14
-
15
-
16
-
17
-
 18
18 -
 19
19 -
 20
20 -
 21
21 -
 22
22 -
 23
23 -
 24
24 -
 25
25 -
 26
26 -
 27
27 -
 28
28 -
 29
29 -
 30
30 -
 31
31 -
 32
32 -
 33
33 -
 34
34 -
 35
35 -
 36
36 -
 37
37 -
 38
38 -
39
-
40
-
41
-
42
-
43
-
44
-
45
-
46
-
47
-
48
-
49
-
50
-
51
-
52
-
53
-
54
-
55
-
56
-
57
-
58
-
59
-
60
-
61
-
62
-
63
-
64
-
65
-
66
-
67
-
68
-
69
-
70
-
71
-
72
-
73
-
74
 |
 |

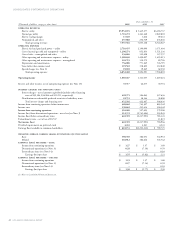
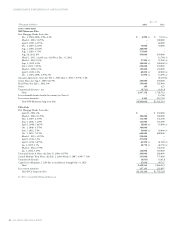
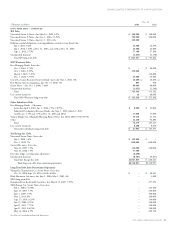
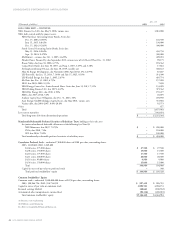
Dec. 31
(Thousands of dollars) 2003 2002
ASSETS
Current assets:
Cash and cash equivalents $573,239 $ 484,700
Restricted cash 37,363 23,000
Accounts receivable – net of allowance for bad debts: $31,106 and $23,970, respectively 658,936 536,476
Accrued unbilled revenues 368,374 390,984
Materials and supplies inventories – at average cost 168,204 191,041
Fuel inventory – at average cost 59,706 67,875
Natural gas inventories – replacement cost in excess of LIFO: $73,197 and $20,502, respectively 141,315 114,981
Recoverable purchased natural gas and electric energy costs 234,859 63,975
Derivative instruments valuation – at market 62,537 6,565
Prepayments and other 142,596 118,768
Current assets held for sale and related to discontinued operations 684,110 1,738,803
Total current assets 3,131,239 3,737,168
Property, plant and equipment, at cost:
Electric utility plant 17,320,268 16,516,790
Natural gas utility plant 2,484,874 2,384,051
Nonregulated property and other 1,553,391 1,534,449
Construction work in progress: utility amounts of $908,256 and $855,842, respectively 932,082 889,902
Total property, plant and equipment 22,290,615 21,325,192
Less accumulated depreciation (8,703,788) (8,084,987)
Nuclear fuel – net of accumulated amortization: $1,101,932 and $1,058,531, respectively 80,289 74,139
Net property, plant and equipment 13,667,116 13,314,344
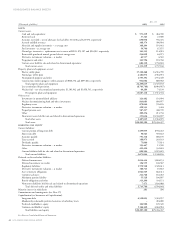
Other assets:
Investments in unconsolidated affiliates 124,462 116,094
Nuclear decommissioning fund and other investments 843,083 699,077
Regulatory assets 879,840 576,876
Derivative instruments valuation – at market 429,531 1,494
Prepaid pension asset 567,227 448,749
Other 209,256 211,738
Noncurrent assets held for sale and related to discontinued operations 353,626 10,330,897
Total other assets 3,407,025 12,384,925
Total assets $20,205,380 $29,436,437
LIABILITIES AND EQUITY
Current liabilities:
Current portion of long-term debt $159,955 $558,263
Short-term debt 58,563 503,643
Accounts payable 791,316 698,170
Taxes accrued 188,973 243,183
Dividends payable 75,866 75,814
Derivative instruments valuation – at market 153,467 11,520
Other 422,420 332,618
Current liabilities held for sale and related to discontinued operations 820,506 9,925,625
Total current liabilities 2,671,066 12,348,836
Deferred credits and other liabilities:
Deferred income taxes 2,014,414 1,894,153
Deferred investment tax credits 156,555 169,587
Regulatory liabilities 1,570,548 1,328,611
Derivative instruments valuation – at market 388,743 10,863
Asset retirement obligations 1,024,529 662,411
Customer advances 212,766 161,283
Minimum pension liability 55,528 106,897
Benefit obligations and other 313,206 334,151
Noncurrent liabilities held for sale and related to discontinued operations 7,471 1,836,088
Total deferred credits and other liabilities 5,743,760 6,504,044
Minority interest in subsidiaries 281 296
Commitments and contingencies (see Note 17)
Capitalization (see Statements of Capitalization):
Long-term debt 6,518,853 5,318,957
Mandatorily redeemable preferred securities of subsidiary trusts –494,000
Preferred stockholders’ equity 104,980 105,320
Common stockholders’ equity 5,166,440 4,664,984
Total liabilities and equity $20,205,380 $29,436,437
See Notes to Consolidated Financial Statements.
44 XCEL ENERGY 2003 ANNUAL REPORT
CONSOLIDATED BALANCE SHEETS