Westjet 2000 Annual Report Download - page 19
Download and view the complete annual report
Please find page 19 of the 2000 Westjet annual report below. You can navigate through the pages in the report by either clicking on the pages listed below, or by using the keyword search tool below to find specific information within the annual report.-
 1
1 -
2
-
3
-
4
-
5
-
6
-
7
-
8
-
 9
9 -
 10
10 -
 11
11 -
 12
12 -
 13
13 -
 14
14 -
 15
15 -
 16
16 -
 17
17 -
 18
18 -
 19
19 -
 20
20 -
 21
21 -
 22
22 -
 23
23 -
 24
24 -
 25
25 -
 26
26 -
 27
27 -
 28
28 -
 29
29 -
30
-
31
-
32
-
33
-
34
-
35
-
36
-
37
-
38
-
39
-
40
 |
 |

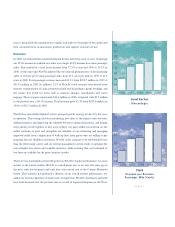
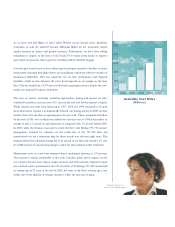
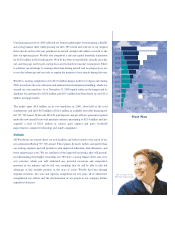
Cost per Available Seat Mile
Excluding Profit Share, Nav Canada
Fees and Impact of Fuel (Cents)
14
12
10
8
1996 1997 1998 1999 2000
10.8
12.0 11.9
12.3
page17
constant despite the increased size of the company, we were able to make unit cost
improvements in this area.
Notably, our insurance costs were favorably reduced in 2000. However, the aviation
insurance market is under strenuous pressure, as premiums are not keeping pace with
claims. WestJet renewed its policies early in 2000. Due to a number of factors – including
our excellent safety record, our history and our plan for growth, and fleet renewal – we
enjoyed a dramatic 25.5% reduction in our unit cost of insurance. We also opted to extend
the new policy term to avoid the volatile insurance market and take advantage of the low
in the market’s cycle.
Like all businesses in Canada, WestJet has benefited from the tax cuts legislated by the
federal and many provincial governments. In 2000, current taxes payable and the
allowance for future income taxes on timing differences amounted to 42.6% of pre-tax
earnings, a reduction from 46.1% in 1999. Our allowance for future corporate income
taxes to both levels of government, on current earnings but deferred and not currently
taxable, is based only on enacted legislation. While we consider the estimates to be
conservative at 40.7%, Management, the Audit Committee, and the Board of Directors
are comfortable with this approach and have developed a plan for adjusting the estimates
downward as further tax changes are passed into law.
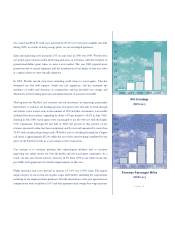
Salaries and wages, before benefits and profit share, account for approximately 15.0% of
WestJet’s total operating costs, which is second only to fuel. Productivity can be measured
by the number of employees needed to operate an aircraft. WestJet had 61 employees per
aircraft in the fleet at the end of 1998, 55 at the end of 1999 and 56 by the end of 2000.
This includes two people per airplane dedicated to planning and executing our transition
to the new Boeing 737-700 jets. Another measure, employees per aircraft in revenue
service, indicated that there were 83 people per revenue aircraft at the end of 1998, 73 at
the end of 1999 and including the 737-700 team, was still down to 72 in December of
2000. This measure disregards the aircraft which are operational spares or are in
maintenance checks.
WestJet’s people are paid mid-market base salary or hourly wage but have the opportunity
to improve that compensation through our profit sharing and employee share purchase
12.0
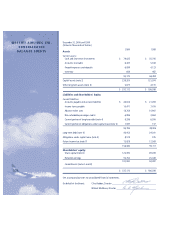
Cost per Available Seat Mile
Excluding Profit Share
and Nav Canada Fees (Cents)
14
12
10
8
1996 1997 1998 1999 2000
10.6
11.6 11.7
12.1
12.8