Vtech 2010 Annual Report Download - page 9
Download and view the complete annual report
Please find page 9 of the 2010 Vtech annual report below. You can navigate through the pages in the report by either clicking on the pages listed below, or by using the keyword search tool below to find specific information within the annual report.-
 1
1 -
 2
2 -
 3
3 -
 4
4 -
 5
5 -
 6
6 -
 7
7 -
 8
8 -
 9
9 -
 10
10 -
 11
11 -
 12
12 -
 13
13 -
 14
14 -
 15
15 -
 16
16 -
 17
17 -
 18
18 -
 19
19 -
 20
20 -
21
-
22
-
23
-
24
-
25
-
26
-
27
-
28
-
29
-
30
-
31
-
32
-
33
-
34
-
35
-
36
-
37
-
38
-
39
-
40
-
41
-
42
-
43
-
44
-
45
-
46
-
47
-
48
-
49
-
50
-
51
-
52
-
53
-
54
-
55
-
56
-
57
-
58
-
59
-
60
-
61
-
62
-
63
-
64
-
65
-
66
-
67
-
68
-
69
-
70
-
71
-
72
 |
 |

VTech Holdings Ltd Annual Report 2010 07
Profi t Attributable to Shareholders and Dividends
The profi t attributable to shareholders of the Company for the year ended
31 March 2010 was US$206.5 million, an increase of US$63.3 million as compared to
the previous fi nancial year.
Basic earnings per share for the year ended 31 March 2010 were US83.7 cents
as compared to US58.5 cents in the previous fi nancial year. During the year, the
Group declared and paid an interim dividend of US16.0 cents per share, which
aggregated to US$39.5 million. The directors have proposed a fi nal dividend of
US62.0 cents per share, which will aggregate to US$153.1 million.
Liquidity and Financial Resources
Shareholders’ funds as at 31 March 2010 were US$515.7 million, a 17.2%
increase from US$440.2 million reported for the fi nancial year 2009. The
shareholders’ funds per share increased by 16.8% from US$1.79 to US$2.09.
The Group had no bank borrowings as at 31 March 2009 and 31 March 2010.
As at 31 March 2010 and 2009 2010 2009
US$ million US$ million
Deposits and cash 382.6 287.2
Currency-linked deposits – 4.9
382.6 292.1
As at 31 March 2010, deposits and cash plus currency-linked deposits with
principal protected had increased to US$382.6 million, rose 31.0% from
US$292.1 million at the previous year-end.
Treasury Policies
The Group’s treasury policies are designed to mitigate the impact of
fl uctuations in foreign currency exchange rates arising from the Group’s global
operations and to minimise the Group’s fi nancial risks. The Group cautiously
uses derivatives, principally forward foreign exchange contracts, as appropriate
for risk management purposes only, for hedging foreign exchange transactions
and for managing the Group’s assets and liabilities. It is the Group’s policy not
to enter into derivative transactions for speculative purposes.
Working Capital
As at 31 March 2010 and 2009
All fi gures are in US$ million unless stated otherwise 2010 2009
Stocks 159.3 128.0
Average stocks as a percentage of Group revenue 9.4% 9.0%
Turnover days 75 days 67 days
Trade debtors 185.7 154.0
Average trade debtors as a percentage of
Group revenue 11.1% 11.6%
Turnover days 61 days 73 days
Stocks as at 31 March 2010 increased by 24.5% over the balance at 31 March
2009 to US$159.3 million. The turnover days increased from 67 days to 75 days.
The increase in stock level was primarily due to advance purchase of raw
materials to cater for the increased demand for the Group’s products in the
fi rst quarter of the fi nancial year 2011.
Trade debtors as at 31 March 2010
was US$185.7 million as compared
to US$154.0 million in the previous
fi nancial year. The turnover days
decreased from 73 days to 61 days.
The increase in trade debtor balance
as at 31 March 2010 was mainly due
to an increase in revenue in the fourth
quarter of fi nancial year 2010 when
compared with the corresponding
period of the previous fi nancial year.
Capital Expenditure
For the year ended 31 March 2010,
the Group invested US$26.3 million in
the purchase of plant and machinery,
equipment, computer systems and
other tangible assets. All of these
capital expenditures were fi nanced
from internal resources.
Capital Commitments and
Contingencies
In the fi nancial year 2011, the Group
will incur capital expenditure of
US$45.2 million for ongoing business
operations. This includes our planning
to further invest US$19.1 million
of capital in Qingyuan, northern
Guangdong province, in the fi nancial
year 2011.
All of these capital expenditures will
be fi nanced from internal resources.
As of the fi nancial year end date, the
Group had no material contingencies.
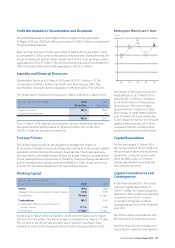
Earnings per Share in Last 5 Years
0
20
40
60
100
80
1009080706
54.9
76.6
89.4
58.5
83.7
US cents