Vtech 2010 Annual Report Download - page 7
Download and view the complete annual report
Please find page 7 of the 2010 Vtech annual report below. You can navigate through the pages in the report by either clicking on the pages listed below, or by using the keyword search tool below to find specific information within the annual report.-
 1
1 -
 2
2 -
 3
3 -
 4
4 -
 5
5 -
 6
6 -
 7
7 -
 8
8 -
 9
9 -
 10
10 -
 11
11 -
 12
12 -
 13
13 -
 14
14 -
 15
15 -
 16
16 -
 17
17 -
 18
18 -
19
-
20
-
21
-
22
-
23
-
24
-
25
-
26
-
27
-
28
-
29
-
30
-
31
-
32
-
33
-
34
-
35
-
36
-
37
-
38
-
39
-
40
-
41
-
42
-
43
-
44
-
45
-
46
-
47
-
48
-
49
-
50
-
51
-
52
-
53
-
54
-
55
-
56
-
57
-
58
-
59
-
60
-
61
-
62
-
63
-
64
-
65
-
66
-
67
-
68
-
69
-
70
-
71
-
72
 |
 |

VTech Holdings Ltd Annual Report 2010 05
Management Discussion and Analysis
revenue decreased by 11.5% to
US$171.4 million over the previous
fi nancial year. This was attributable
to reduced orders and decreased
stock replenishment from customers.
Sales rebounded in the second half as
customers began to restock, but this
was unable to off set the sales decline
in the fi rst half. Sales of ELPs to
Europe declined to US$241.7 million,
a decrease of 6.5%. The decrease
resulted from declining consumer
demand and lower average selling
prices of ELPs. Revenue from CMS
fell by 2.0% to US$115.8 million. The
decrease was mainly due to lower
sales in the areas of switching mode
power supplies and wireless products,
which were impacted by the
economic contraction in the region.
For Asia Pacifi c, all product lines
achieved sales increases. Sales of
TEL products to Asia Pacifi c rose by
59.0% to US$22.9 million. The growth
was partly due to higher sales to
Australia following the agreement
with Australian telecommunications
and information services company
Telstra. For ELPs, revenue from Asia
Pacifi c increased by 23.4% to US$15.8
million in the fi nancial year because
of an increase in sales of platform and
standalone products. Revenue from
CMS increased by 52.9% to US$42.8
million over the previous fi nancial
year. Growth was mainly driven by
a customer in the area of solid
state lighting.
For other regions, revenue decreased
mainly because of a sales decline in
ELPs, partly off set by a sales growth in
TEL products. Sales of TEL products to
other regions were US$32.8 million,
an increase of 13.9% over the previous
fi nancial year. Revenue of ELPs from
other regions decreased by 22.5% to
US$16.2 million in the fi nancial year.
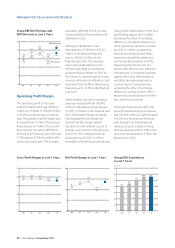
Gross Profi t/Margin
The gross profi t for the fi nancial
year 2010 was US$559.4 million, an
increase of US$31.9 million or 6.0%
compared to the US$527.5 million
recorded in the previous fi nancial
year. Gross profi t margin for the year
was 36.5% against 36.4% recorded in
the previous fi nancial year. The Group
was able to maintain gross profi t
margin because of stable material and
labour costs for much of the period.
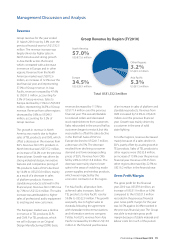
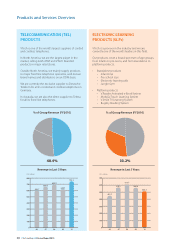
Revenue
Group revenue for the year ended
31 March 2010 rose by 5.8% over the
previous fi nancial year to US$1,532.3
million. The revenue increase was
largely driven by higher sales in
North America and strong growth
in Asia Pacifi c across the board,
which contrasted with a decrease
in revenue in Europe and in other
regions. Revenue from the North
American market was US$872.6
million, an increase of 12.9% over the
last fi nancial year, and representing
57.0% of Group revenue. In Asia
Pacifi c, revenue increased by 47.6%
to US$81.5 million, accounting for
5.3% of Group revenue. Sales to
Europe declined by 7.3% to US$528.9
million, representing 34.5% of Group
revenue. Revenue from other regions
decreased by 0.8% to US$49.3
million, accounting for 3.2% of
Group revenue.
The growth in revenue in North
America was mainly due to higher
sales of TEL products and CMS, which
off set a decrease in the revenue from
ELPs. Revenue from TEL products in
North America was US$515.2 million,
an increase of 34.2% over the previous
fi nancial year. Growth was driven by
strong industrial design, innovative
features and competitive pricing of
TEL products. Sales of ELPs declined
by 14.4% to US$235.0 million, mainly
as a result of a decrease in sales
of platform products. However,
standalone products sold well in the
fi nancial year. Revenue from CMS rose
by 7.0% to US$122.4 million. The sales
increase was attributable to higher
sales of professional audio equipment
to existing and new customers.
The European market saw a decline
in revenue in TEL products, ELPs
and CMS. For TEL products, which
we sell in Europe on an Original
Design Manufacturing (ODM) basis,
Europe
34.5%
US$528.9 million
Asia Pacific
US$81.5 million
5.3%
Other Regions
3.2%
US$49.3 million
North America
57.0%
US$872.6 million
Group Revenue by Region (FY2010)
Total: US$1,532.3 million