Vtech 2010 Annual Report Download - page 8
Download and view the complete annual report
Please find page 8 of the 2010 Vtech annual report below. You can navigate through the pages in the report by either clicking on the pages listed below, or by using the keyword search tool below to find specific information within the annual report.-
 1
1 -
 2
2 -
 3
3 -
 4
4 -
 5
5 -
 6
6 -
 7
7 -
 8
8 -
 9
9 -
 10
10 -
 11
11 -
 12
12 -
 13
13 -
 14
14 -
 15
15 -
 16
16 -
 17
17 -
 18
18 -
 19
19 -
20
-
21
-
22
-
23
-
24
-
25
-
26
-
27
-
28
-
29
-
30
-
31
-
32
-
33
-
34
-
35
-
36
-
37
-
38
-
39
-
40
-
41
-
42
-
43
-
44
-
45
-
46
-
47
-
48
-
49
-
50
-
51
-
52
-
53
-
54
-
55
-
56
-
57
-
58
-
59
-
60
-
61
-
62
-
63
-
64
-
65
-
66
-
67
-
68
-
69
-
70
-
71
-
72
 |
 |

06 VTech Holdings Ltd Annual Report 2010
Management Discussion and Analysis
Operating Profi t/Margin
The operating profi t for the year
ended 31 March 2010 was US$224.1
million, an increase of US$69.8 million
or 45.2% over the previous fi nancial
year. The operating profi t margin also
increased from 10.7% in the previous
fi nancial year to 14.6% in the current
fi nancial year. The ratio of EBITDA to
revenue in the fi nancial year 2010 was
17.0% against 12.9% recorded in the
previous fi nancial year. The increase
was partly refl ected by the increase
in gross profi t and lower selling and
distribution costs.
Selling and distribution costs
decreased by 10.7% from US$232.1
million in the previous fi nancial
year to US$207.3 million in the
fi nancial year 2010. The decrease
was mainly attributable to more
eff ective spending on advertising
and promotional dollars for ELPs by
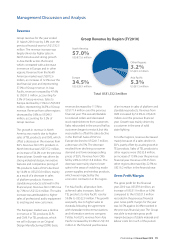
the Group. As a percentage of Group
revenue, selling and distribution costs
decreased from 16.0% in the previous
fi nancial year to 13.5% in the fi nancial
year 2010.
Administrative and other operating
expenses decreased from US$84.2
million in the previous fi nancial year
to US$71.2 million in the fi nancial year
2010. With better foreign exchange
risk management, exchange loss
arising from the Group’s global
operations in the ordinary course of
business was minimal in the fi nancial
year 2010. This contrasted with an
exchange loss of US$27.6 million
recorded in the previous fi nancial year
owing to the depreciation of the Euro
and Sterling against the US dollar.
Excluding the eff ect of exchange
diff erences, the administrative and
other operating expenses increased
by US$14.6 million compared to
the previous fi nancial year. These
expenses included the settlement
and license fees together with the
legal and professional costs of a
lawsuit with Motorola Inc. related to
infringement of six patents asserted
against the Group. Administrative
and other operating expenses as
a percentage of Group revenue,
excluding the eff ect of exchange
diff erences, increased from 3.9% in
the previous fi nancial year to 4.6% in
the current fi nancial year.
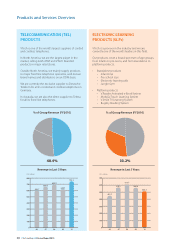
During the fi nancial year 2010, the
research and development expense
was US$56.8 million, a slight decrease
of 0.2% over the previous fi nancial
year. Research and development
expense as a percentage of Group
revenue decreased from 3.9% in the
previous fi nancial year to 3.7% in the
fi nancial year 2010.
Group R&D Expenditure
in Last 5 Years
40.3
45.2
51.3
56.9 56.8
0
10
20
30
40
50
60
70
US$ million
06 07 08 09 10
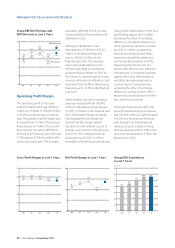
Gross Profi t Margin in Last 5 Years
06 07 08 09 10
0
10
20
30
40 37.1
50
%
36.9 37.6
36.4 36.5
Net Profi t Margin in Last 5 Years
06 07 08 09 10
0
5
10
15
10.7
20
%
12.5
13.9
9.9
13.5
Group EBITDA/Revenue and
EBIT/Revenue in Last 5 Years
12.9
11.3
14.9
13.3
16.6
14.7 12.9
10.7
17.0
14.6
%
EBITDA/Revenue
EBIT/Revenue
06 07 08 09 10
0
4
8
12
16
20