Vtech 2010 Annual Report Download - page 11
Download and view the complete annual report
Please find page 11 of the 2010 Vtech annual report below. You can navigate through the pages in the report by either clicking on the pages listed below, or by using the keyword search tool below to find specific information within the annual report.-
 1
1 -
 2
2 -
 3
3 -
 4
4 -
 5
5 -
 6
6 -
 7
7 -
 8
8 -
 9
9 -
 10
10 -
 11
11 -
 12
12 -
 13
13 -
 14
14 -
 15
15 -
 16
16 -
 17
17 -
 18
18 -
 19
19 -
 20
20 -
 21
21 -
 22
22 -
23
-
24
-
25
-
26
-
27
-
28
-
29
-
30
-
31
-
32
-
33
-
34
-
35
-
36
-
37
-
38
-
39
-
40
-
41
-
42
-
43
-
44
-
45
-
46
-
47
-
48
-
49
-
50
-
51
-
52
-
53
-
54
-
55
-
56
-
57
-
58
-
59
-
60
-
61
-
62
-
63
-
64
-
65
-
66
-
67
-
68
-
69
-
70
-
71
-
72
 |
 |

VTech Holdings Ltd Annual Report 2010 09
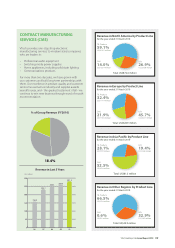
CONTRACT MANUFACTURING
SERVICES (CMS)
VTech provides one-stop shop electronic
manufacturing services to medium sized companies
who are leaders in:
• Professional audio equipment
• Switching mode power supplies
• Home appliances, including solid state lighting
• Communications products
For more than two decades, we have grown with
our customers and built long-term partnerships with
them. Our excellence in product quality and customer
service has earned us industry and supplier awards
year after year, and - the greatest testament of all - we
continue to win new business through word of mouth
recommendation.
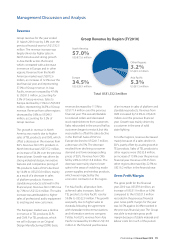
% of Group Revenue (FY2010)
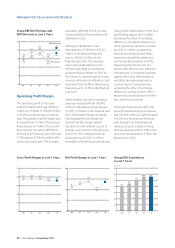
Revenue in Last 5 Years
18.4%
US$ million
0
50
100
200
150
250
300
158.2
06 07 08 09 10
233.1
248.3 260.6
281.3
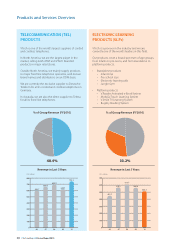
ELPs
26.9%
US$235.0 million
Total: US$872.6 million
TEL Products
59.1%
US$515.2 million
CMS
14.0%
US$122.4 million
Revenue in North America by Product Line
for the year ended 31 March 2010
Revenue in Europe by Product Line
for the year ended 31 March 2010
Total: US$528.9 million
TEL Products
32.4%
US$171.4 million
ELPs
45.7%
US$241.7 million
CMS
21.9%
US$115.8 million
Revenue in Asia Pacific by Product Line
for the year ended 31 March 2010
Total: US$81.5 million
CMS
52.5%
US$42.8 million
ELPs
19.4%
US$15.8 million
TEL Products
28.1%
US$22.9 million
Revenue in Other Regions by Product Line
for the year ended 31 March 2010
Total: US$49.3 million
TEL Products
66.5%
US$32.8 million
ELPs
32.9%
US$16.2 million
CMS
0.6%
US$0.3 million