Vtech 2010 Annual Report Download - page 10
Download and view the complete annual report
Please find page 10 of the 2010 Vtech annual report below. You can navigate through the pages in the report by either clicking on the pages listed below, or by using the keyword search tool below to find specific information within the annual report.-
 1
1 -
 2
2 -
 3
3 -
 4
4 -
 5
5 -
 6
6 -
 7
7 -
 8
8 -
 9
9 -
 10
10 -
 11
11 -
 12
12 -
 13
13 -
 14
14 -
 15
15 -
 16
16 -
 17
17 -
 18
18 -
 19
19 -
 20
20 -
 21
21 -
22
-
23
-
24
-
25
-
26
-
27
-
28
-
29
-
30
-
31
-
32
-
33
-
34
-
35
-
36
-
37
-
38
-
39
-
40
-
41
-
42
-
43
-
44
-
45
-
46
-
47
-
48
-
49
-
50
-
51
-
52
-
53
-
54
-
55
-
56
-
57
-
58
-
59
-
60
-
61
-
62
-
63
-
64
-
65
-
66
-
67
-
68
-
69
-
70
-
71
-
72
 |
 |

08 VTech Holdings Ltd Annual Report 2010
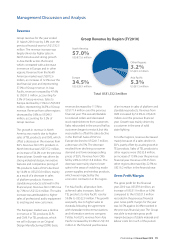
TELECOMMUNICATION (TEL)
PRODUCTS
VTech is one of the world’s largest suppliers of corded
and cordless telephones.
In North America, we are the largest player in the
market, selling both AT&T and VTech branded
products in major retail stores.
Outside North America, we mainly supply products
to major fi xed line telephone operators, well-known
brand names and distributors on an ODM basis.
We are currently the exclusive supplier to Deutsche
Telekom for all its corded and cordless telephones in
Germany.
In Australia, we are also the direct supplier to Telstra
for all its fi xed line telephones.
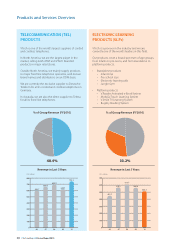
ELECTRONIC LEARNING
PRODUCTS
(ELPs)
VTech is a pioneer in the industry and we are
currently one of the world’s leaders in this fi eld.
Our products cover a board spectrum of age groups,
from infants to pre-teens, and from standalone to
platform products:
• Standalone products
– Infant toys
– Pre-school toys
– Electronic learning aids
– Jungle Gym
• Platform products
– V.Reader Animated e-Book System
– MobiGo Touch Learning System
– V.Smile TV Learning System
– Bugsby Reading System
% of Group Revenue (FY2010) % of Group Revenue (FY2010)
Revenue in Last 5 Years Revenue in Last 5 Years
33.2%48.4%
US$ million
0
100
200
300
400
500
600
700
451.7
570.1
615.7
566.9
508.7
06 07 08 09 10
US$ million
0
100
200
300
400
500
600
700
800
594.7
06 07 08 09 10
660.6
688.0
620.7
742.3
Products and Services Overview