Vtech 2010 Annual Report Download - page 3
Download and view the complete annual report
Please find page 3 of the 2010 Vtech annual report below. You can navigate through the pages in the report by either clicking on the pages listed below, or by using the keyword search tool below to find specific information within the annual report.-
 1
1 -
 2
2 -
 3
3 -
 4
4 -
 5
5 -
 6
6 -
 7
7 -
 8
8 -
 9
9 -
 10
10 -
 11
11 -
 12
12 -
 13
13 -
 14
14 -
15
-
16
-
17
-
18
-
19
-
20
-
21
-
22
-
23
-
24
-
25
-
26
-
27
-
28
-
29
-
30
-
31
-
32
-
33
-
34
-
35
-
36
-
37
-
38
-
39
-
40
-
41
-
42
-
43
-
44
-
45
-
46
-
47
-
48
-
49
-
50
-
51
-
52
-
53
-
54
-
55
-
56
-
57
-
58
-
59
-
60
-
61
-
62
-
63
-
64
-
65
-
66
-
67
-
68
-
69
-
70
-
71
-
72
 |
 |

VTech Holdings Ltd Annual Report 2010 01
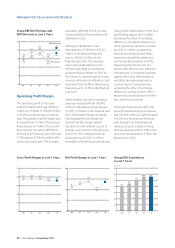
For the year ended 31 March 2010 2009 Change
Operating results (US$ million)
Revenue 1,532.3 1,448.2 5.8%
Gross profit 559.4 527.5 6.0%
Operating profit 224.1 154.3 45.2%
Profit before taxation 225.5 159.0 41.8%
Profit attributable to shareholders of the Company 206.5 143.2 44.2%
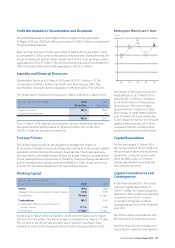
Financial position (US$ million)
Cash generated from operations 255.8 196.1 30.4%
Net cash 382.6 287.2 33.2%
Shareholders’ funds 515.7 440.2 17.2%
Per share data (US cents)
Earnings per share – basic 83.7 58.5 43.1%
Earnings per share – diluted 83.4 58.4 42.8%
Dividend per share
– Interim and Final 78.0 53.0 47.2%
Other data (US$ million)
Capital expenditure 26.3 27.1 -3.0%
R&D expenditure 56.8 56.9 -0.2%
Key ratios (%)
Gross profit margin 36.5 36.4 0.1% pts
Operating profit margin 14.6 10.7 3.9% pts
Net profit margin # 13.5 9.9 3.6% pts
EBITDA/Revenue 17.0 12.9 4.1% pts
Return on shareholders’ funds 40.0 32.5 7.5% pts
US$ million
0
300
600
900
1,200
1,500
1,800
1,204.6
06 07 08 09 10
1,463.8 1,552.0 1,448.2 1,532.3
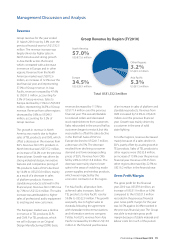
Group Revenue in Last 5 Years Profit Attributable to Shareholders
of the Company in Last 5 Years
Dividend per Share in Last 5 Years
* Include a special dividend of US30.0 cents per share
# Net profit margin is calculated by profit attributable to shareholders of the Company to revenue
Financial Highlights
US cents
0
20
40
60
80
100
32.0
06 07 08 09 10
80.0*
63.0
53.0
78.0
0
50
100
150
200
250
128.8
06 07 08 09 10
182.9
215.7
143.2
206.5
US$ million