Vonage 2013 Annual Report Download - page 42
Download and view the complete annual report
Please find page 42 of the 2013 Vonage annual report below. You can navigate through the pages in the report by either clicking on the pages listed below, or by using the keyword search tool below to find specific information within the annual report.-
 1
1 -
2
-
3
-
4
-
5
-
6
-
7
-
8
-
9
-
10
-
11
-
12
-
13
-
14
-
15
-
16
-
17
-
18
-
19
-
20
-
21
-
22
-
23
-
24
-
25
-
26
-
27
-
28
-
29
-
30
-
31
-
 32
32 -
 33
33 -
 34
34 -
 35
35 -
 36
36 -
 37
37 -
 38
38 -
 39
39 -
 40
40 -
 41
41 -
 42
42 -
 43
43 -
 44
44 -
 45
45 -
 46
46 -
 47
47 -
 48
48 -
 49
49 -
 50
50 -
 51
51 -
 52
52 -
53
-
54
-
55
-
56
-
57
-
58
-
59
-
60
-
61
-
62
-
63
-
64
-
65
-
66
-
67
-
68
-
69
-
70
-
71
-
72
-
73
-
74
-
75
-
76
-
77
-
78
-
79
-
80
-
81
-
82
-
83
-
84
-
85
-
86
-
87
-
88
-
89
-
90
-
91
-
92
-
93
-
94
-
95
-
96
-
97
-
98
 |
 |

36 VONAGE ANNUAL REPORT 2013
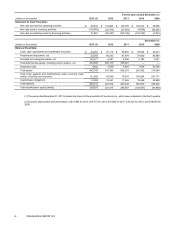
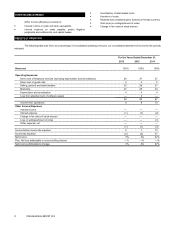
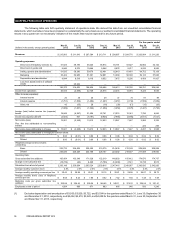
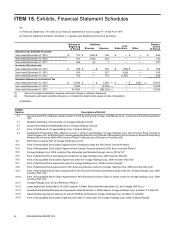
QUARTERLY RESULTS OF OPERATIONS
The following table sets forth quarterly statement of operations data. We derived this data from our unaudited consolidated financial
statements, which we believe have been prepared on substantially the same basis as our audited consolidated financial statements. The operating
results in any quarter are not necessarily indicative of the results that may be expected for any future period.
For the quarter ended
(dollars in thousands, except operating data)
Mar 31,
2012
Jun 30,
2012
Sep 30,
2012
Dec 31,
2012
Mar 31,
2013
Jun 30,
2013
Sep 30,
2013
Dec 31,
2013
Revenues $ 215,903 $ 211,916 $ 207,584 $ 213,711 $ 209,087 $ 204,776 $ 203,984 $ 211,220
Operating expenses:
Direct cost of telephony services (1) 61,623 58,195 55,245 56,814 55,181 53,527 52,882 52,122
Direct cost of goods sold 9,846 9,275 10,444 9,568 8,878 9,217 9,535 9,956
Selling, general and administrative 61,835 58,396 59,676 62,461 62,910 61,481 64,752 73,159
Marketing 53,422 54,956 51,361 52,801 51,669 58,330 59,133 57,920
Depreciation and amortization 8,644 8,518 8,110 8,052 7,975 8,205 8,459 11,427
Loss from abandonment of software
assets — 25,262 ——————
195,370 214,602 184,836 189,696 186,613 190,760 194,761 204,584
Income from operations 20,533 (2,686) 22,748 24,015 22,474 14,016 9,223 6,636
Other income (expense):
Interest income 20 30 30 29 37 74 97 99
Interest expense (1,751) (1,566) (1,402) (1,267) (1,457) (1,732) (1,509) (1,859)
Other, net 42 (65) 28 (16) (39) (17) (15) (33)
(1,689) (1,601) (1,344) (1,254) (1,459) (1,675) (1,427) (1,793)
Income (loss) before income tax (expense)
benefit 18,844 (4,287) 21,404 22,761 21,015 12,341 7,796 4,843
Income tax (expense) benefit (4,923) 947 (8,191) (9,928) (7,968) (4,894) (3,811) (1,521)
Net income (loss) 13,921 (3,340) 13,213 12,833 13,047 7,447 3,985 3,322
Plus: Net loss attributable to noncontrolling
interest ——————222266
Net income (loss) attributable to Vonage $ 13,921 $ (3,340) $ 13,213 $ 12,833 $ 13,047 $ 7,447 $ 4,207 $ 3,588
Net income (loss) attributable to Vonage per common share:
Basic $ 0.06 $ (0.01) $ 0.06 $ 0.06 $ 0.06 $ 0.04 $ 0.02 $ 0.02
Diluted $ 0.06 $ (0.01) $ 0.06 $ 0.06 $ 0.06 $ 0.03 $ 0.02 $ 0.02
Weighted-average common shares
outstanding:
Basic 225,732 226,429 225,555 219,379 214,639 212,169 209,589 209,928
Diluted 236,036 226,429 233,708 228,107 223,202 219,837 217,059 219,600
Operating Data:
Gross subscriber line additions 165,454 163,349 171,628 152,319 148,003 155,412 174,670 174,767
Change in net subscriber line (18,739) (64) 9,440 (5,708) (12,400) 2,541 10,738 8,513
Subscriber lines at end of period 2,356,148 2,356,084 2,365,524 2,359,816 2,347,416 2,349,957 2,360,695 2,542,926
Average monthly customer churn 2.8% 2.5% 2.5% 2.5% 2.5% 2.4% 2.6% 2.5%
Average monthly operating revenues per line $ 30.42 $ 29.98 $ 29.31 $ 30.15 $ 29.61 $ 29.06 $ 28.87 $ 28.72
Average monthly direct costs of telephony
services per line $ 8.68 $ 8.23 $ 7.80 $ 8.02 $ 7.82 $ 7.60 $ 7.48 $ 7.09
Marketing costs per gross subscriber line
additions $ 322.88 $ 336.43 $ 299.26 $ 346.65 $ 349.11 $ 375.32 $ 338.54 $ 331.41
Employees at end of period 1,004 988 971 983 966 946 933 1,243
(1) Excludes depreciation and amortization of $3,930, $3,929, $3,722, and $3,534 for the quarters ended March 31, June 30, September 30
and December 31, 2012, respectively, and $3,452, $3,510, $3,522, and $4,408 for the quarters ended March 31, June 30, September 30
and December 31, 2013, respectively.
Table of Contents