Vonage 2013 Annual Report Download - page 38
Download and view the complete annual report
Please find page 38 of the 2013 Vonage annual report below. You can navigate through the pages in the report by either clicking on the pages listed below, or by using the keyword search tool below to find specific information within the annual report.-
 1
1 -
2
-
3
-
4
-
5
-
6
-
7
-
8
-
9
-
10
-
11
-
12
-
13
-
14
-
15
-
16
-
17
-
18
-
19
-
20
-
21
-
22
-
23
-
24
-
25
-
26
-
27
-
 28
28 -
 29
29 -
 30
30 -
 31
31 -
 32
32 -
 33
33 -
 34
34 -
 35
35 -
 36
36 -
 37
37 -
 38
38 -
 39
39 -
 40
40 -
 41
41 -
 42
42 -
 43
43 -
 44
44 -
 45
45 -
 46
46 -
 47
47 -
 48
48 -
49
-
50
-
51
-
52
-
53
-
54
-
55
-
56
-
57
-
58
-
59
-
60
-
61
-
62
-
63
-
64
-
65
-
66
-
67
-
68
-
69
-
70
-
71
-
72
-
73
-
74
-
75
-
76
-
77
-
78
-
79
-
80
-
81
-
82
-
83
-
84
-
85
-
86
-
87
-
88
-
89
-
90
-
91
-
92
-
93
-
94
-
95
-
96
-
97
-
98
 |
 |

32 VONAGE ANNUAL REPORT 2013
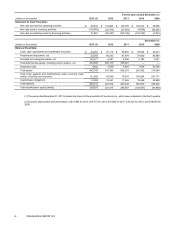
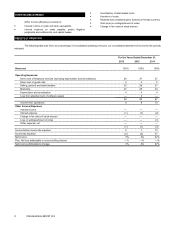
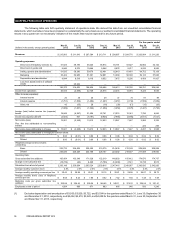
Summary of Results for the Years Ended December 31, 2013, 2012, and 2011
Revenues, Direct Cost of Telephony Services and
Direct Cost of Good Sold For the years ended December 31,
Dollar
Change
2013 vs.
2012
Dollar
Change
2012 vs.
2011
Percent
Change
2013 vs.
2012
Percent
Change
2012 vs.
2011
(in thousands, except percentages) 2013 2012 2011
Revenues $ 829,067 $ 849,114 $ 870,323 $ (20,047) $ (21,209) (2)% (2)%
Direct cost of telephony services (1) 213,712 231,877 236,149 (18,165) (4,272) (8)% (2)%
Direct cost of goods sold 37,586 39,133 41,756 (1,547) (2,623) (4)% (6)%
(1) Excludes depreciation and amortization of $14,892, $15,115, and $15,824, respectively.
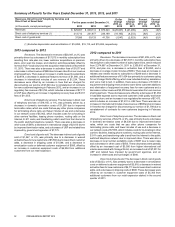
2013 compared to 2012
Revenues. The decrease in revenues of $20,047, or 2%, was
primarily driven by a decrease of $17,573 in monthly subscription fees
resulting from rate plan mix, lower customer acquisitions on premium
plans, prior year line losses, and retention activities partially offset by
revenue from Vocalocity since the acquisition that closed on November
15, 2013. There was also a decrease in activation fees of $1,077 and
a decrease in other revenue of $996 due to lower rates from our revenue
sharing partners. There was an increase in credits issued to subscribers
of $2,449, a decrease in additional features revenue of $1,090, and a
decrease in international minutes of use revenue of $1,234. These
decreases were offset by an increase in fees that we charged for
disconnecting our service of $1,024 due to reinstatement of contracts
for new customers beginning in February 2012, and an increase in our
regulatory fee revenue of $3,784, which includes a decrease of $7,771
in USF fees offset by an increase in regulatory recovery fees and E-911
fees of $11,555.
Direct cost of telephony services. The decrease in direct cost
of telephony services of $18,165, or 8%, was primarily driven by a
decrease in domestic termination costs of $1,290 due to improved
termination rates, which are costs that we pay other phone companies
for terminating phone calls, and fewer minutes of use and a decrease
in our network costs of $5,962, which includes costs for co-locating in
other carriers’ facilities, leasing phone numbers, routing calls on the
Internet, E-911 costs, and transferring calls to and from the Internet to
the public switched telephone network. There was also a decrease in
other costs of $678, a decrease in international usage of $2,413 driven
by improved termination rates, and a decrease of USF and related fees
imposed by government agencies of $7,775.
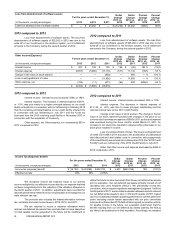
Direct cost of goods sold. The decrease in direct cost of goods
sold of $1,547, or 4%, was primarily due to a decrease in waived
activation fees for new customers of $5,566 due to lower direct customer
adds, a decrease in shipping costs of $1,598, and a decrease in
amortization costs on deferred customer equipment of $585, offset by
an increase in customer equipment costs of $6,204 from additional
customers from our retail expansion.
2012 compared to 2011
Revenues. The decrease in revenues of $21,209, or 2%, was
primarily driven by a decrease of $21,307 in monthly subscription fees
resulting from a decreased number of subscription lines, which reduced
from 2,374,887 at December 31, 2011 to 2,359,816 at December 31,
2012, and plan mix, a decrease in activation fees of $3,850, and a
decrease in overage in plan minutes of $864. There was an increase in
rebates and credits issued to subscribers of $249 and a decrease in
additional features revenue of $1,424 due primarily to customers opting
for our Vonage World offering, which now includes directory assistance
and voice mail to text. In addition, there was a decrease of $1,663 in
equipment and shipping revenue due to lower direct customer additions
and elimination of equipment recovery fees for new customers and a
decrease in other revenue of $2,578 due to lower rates from our revenue
sharing partners. These decreases were offset by a decrease of $1,064
in bad debt expense due to improved customer credit quality and lower
non-pay churn, and an increase in our regulatory fee revenue of $7,473,
which includes an increase of $7,231 in USF fees. There was also an
increase in international minutes of use revenue of $390 and an increase
in fees that we charged for disconnecting our service of $1,798 due to
reinstatement of contracts for new customers beginning in February
2012.
Direct cost of telephony services. The decrease in direct cost
of telephony services of $4,272, or 2%, was primarily due to a decrease
in domestic termination costs of $8,538 due to improved termination
rates, which are costs that we pay other phone companies for
terminating phone calls, and fewer minutes of use and a decrease in
our network costs of $7,550, which includes costs for co-locating in other
carriers’ facilities, leasing phone numbers, routing calls on the Internet,
E-911 costs, and transferring calls to and from the Internet to the public
switched telephone network due to improved rates. There was also a
decrease in local number portability costs of $837 due to lower rates
and a decrease in other costs of $503. These decreases were partially
offset by an increased cost of $5,386 from higher international call
volume associated with Vonage World, an increased cost of $7,231 for
USF and related fees imposed by government agencies, and an
increase in other taxes and surcharges of $540.
Direct cost of goods sold. The decrease in direct cost of goods
sold of $2,623, or 6%, was primarily due to a decrease in amortization
costs on deferred customer equipment of $2,918, a decrease in waived
activation fees for new customers of $4,711 due to lower direct customer
adds, and a decrease in shipping costs of $300. These decreases were
offset by an increase in customer equipment costs of $5,303 from
additional customers from our retail expansion started in the second
quarter of 2011.
Table of Contents