Vonage 2013 Annual Report Download - page 40
Download and view the complete annual report
Please find page 40 of the 2013 Vonage annual report below. You can navigate through the pages in the report by either clicking on the pages listed below, or by using the keyword search tool below to find specific information within the annual report.-
 1
1 -
2
-
3
-
4
-
5
-
6
-
7
-
8
-
9
-
10
-
11
-
12
-
13
-
14
-
15
-
16
-
17
-
18
-
19
-
20
-
21
-
22
-
23
-
24
-
25
-
26
-
27
-
28
-
29
-
 30
30 -
 31
31 -
 32
32 -
 33
33 -
 34
34 -
 35
35 -
 36
36 -
 37
37 -
 38
38 -
 39
39 -
 40
40 -
 41
41 -
 42
42 -
 43
43 -
 44
44 -
 45
45 -
 46
46 -
 47
47 -
 48
48 -
 49
49 -
 50
50 -
51
-
52
-
53
-
54
-
55
-
56
-
57
-
58
-
59
-
60
-
61
-
62
-
63
-
64
-
65
-
66
-
67
-
68
-
69
-
70
-
71
-
72
-
73
-
74
-
75
-
76
-
77
-
78
-
79
-
80
-
81
-
82
-
83
-
84
-
85
-
86
-
87
-
88
-
89
-
90
-
91
-
92
-
93
-
94
-
95
-
96
-
97
-
98
 |
 |

34 VONAGE ANNUAL REPORT 2013
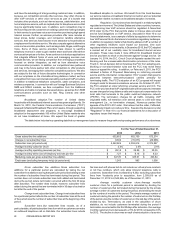
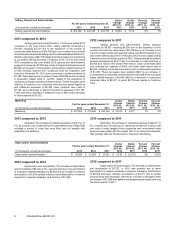
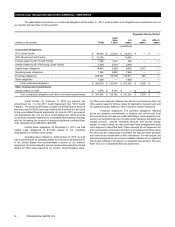
Loss from abandonment of software assets
For the years ended December 31, Dollar
Change
2013 vs.
2012
Dollar
Change
2012 vs.
2011
Percent
Change
2013 vs.
2012
Percent
Change
2012 vs.
2011
(in thousands, except percentages) 2,013 2,012 2,011
Loss from abandonment of software assets $—$
25,262 $ — $ (25.262) $ 25.262 (100)% 100%
2013 compared to 2012
Loss from abandonment of software assets. The loss from
abandonment of software assets of $25,262 in 2012 was due to the
write-off of our investment in the Amdocs system, net of settlement
amounts to the Company, during the second quarter of 2012.
2012 compared to 2011
Loss from abandonment of software assets. The loss from
abandonment of software assets of $25,262 in 2012 was due to the
write-off of our investment in the Amdocs system, net of settlement
amounts to the Company, during the second quarter of 2012.
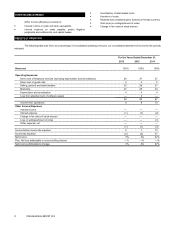
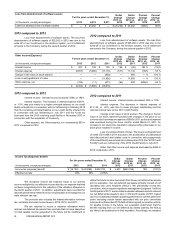
Other Income (Expense)
For the years ended December 31, Dollar
Change
2013 vs.
2012
Dollar
Change
2012 vs.
2011
Percent
Change
2013 vs.
2012
Percent
Change
2012 vs.
2011
(in thousands, except percentages) 2013 2012 2011
Interest income $ 307 $ 109 $135 $198 $(26)182 %(19)%
Interest expense (6,557) (5,986) (17,118) (571)11,132 (10)% 65 %
Change in fair value of stock warrant ——
(950)—
950 —% 100 %
Loss on extinguishment of notes — — (11,806) — 11,806 —% 100 %
Other expense, net (104)(11)(271)(93)260 (845)% 96 %
$ (6,354) $ (5,888) $ (30,010)
2013 compared to 2012
Interest income. Interest income increased $198, or 182%.
Interest expense. The increase in interest expense of $571,
or 10%, was due mainly to a higher principal balance on our credit
facility entered into in connection with our refinancing in February 2013
than the remaining principal balance on our credit facility entered into
in connection with our refinancing in July 2011 and the funds we
borrowed from the 2013 revolving credit facility in November 2013 in
connection with the acquisition of Vocalocity.
Other expense, net. Other expense, net increased by $93 in
2013 compared to 2012.
2012 compared to 2011
Interest income. Interest income decreased $26, or 19%.
Interest expense. The decrease in interest expense of
$11,132, or 65%, was due to lower principal outstanding and the
reduced interest rate on the 2011 Credit Facility.
Change in fair value of stock warrant. The change in the fair
value of our stock warrant fluctuated with changes in the price of our
common stock and was an expense of $950 in 2011, as the stock warrant
was exercised during the three months ended March 31, 2011. An
increase in our stock price resulted in expense while a decrease in our
stock price resulted in income.
Loss on extinguishment of notes. The loss on extinguishment
of notes of $11,806 in 2011 was due to the acceleration of unamortized
debt discount and debt related costs in connection with prepayments
of the credit facility we entered into in December 2010 (the "2010 Credit
Facility") and our refinancing of the 2010 Credit Facility in July 2011.
Other. Net other income and expense decreased by $260 in
2012 compared to 2011.
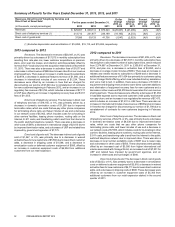
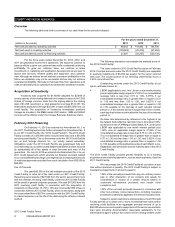
Income Tax (Expense) Benefit
For the years ended December 31, Dollar
Change
2013 vs.
2012
Dollar
Change
2012 vs.
2011
Percent
Change
2013 vs.
2012
Percent
Change
2012 vs.
2011
(in thousands, except percentages) 2013 2012 2011
Income tax (expense) benefit $ (18,194) $ (22,095) $322,704 $ 3,901 $
(344,799) 18% (107)%
Effective tax rate 39% 38% (375)%
We recognize income tax expense equal to our pre-tax
income multiplied by our effective income tax rate, an expense that had
not been recognized prior to the reduction of the valuation allowance in
the fourth quarter of 2011. In addition, adjustments were recorded for
discrete period items related to stock compensation and changes to our
state effective tax rate.
The provision also includes the federal alternative minimum
tax and state and local income taxes in 2013, 2012, and 2011.
We are required to record a valuation allowance which
reduces net deferred tax assets if we conclude that it is more likely than
not that taxable income generated in the future will be insufficient to
utilize the future income tax benefit from these net deferred tax assets
prior to expiration. Our net deferred tax assets primarily consist of net
operating loss carry forwards (“NOLs”). We periodically review this
conclusion, which requires significant management judgment. Until the
fourth quarter of 2011, we recorded a valuation allowance which reduced
our net deferred tax assets to zero. In the fourth quarter of 2011, based
upon our sustained profitable operating performance over the past three
years excluding certain losses associated with our prior convertible
notes and our December 2010 debt refinancing and our positive outlook
for taxable income in the future, our evaluation determined that the
benefit resulting from our net deferred tax assets (namely, the NOLs)
are likely to be usable prior to their expiration. Accordingly, we released
Table of Contents