Vonage 2013 Annual Report Download - page 39
Download and view the complete annual report
Please find page 39 of the 2013 Vonage annual report below. You can navigate through the pages in the report by either clicking on the pages listed below, or by using the keyword search tool below to find specific information within the annual report.-
 1
1 -
2
-
3
-
4
-
5
-
6
-
7
-
8
-
9
-
10
-
11
-
12
-
13
-
14
-
15
-
16
-
17
-
18
-
19
-
20
-
21
-
22
-
23
-
24
-
25
-
26
-
27
-
28
-
 29
29 -
 30
30 -
 31
31 -
 32
32 -
 33
33 -
 34
34 -
 35
35 -
 36
36 -
 37
37 -
 38
38 -
 39
39 -
 40
40 -
 41
41 -
 42
42 -
 43
43 -
 44
44 -
 45
45 -
 46
46 -
 47
47 -
 48
48 -
 49
49 -
50
-
51
-
52
-
53
-
54
-
55
-
56
-
57
-
58
-
59
-
60
-
61
-
62
-
63
-
64
-
65
-
66
-
67
-
68
-
69
-
70
-
71
-
72
-
73
-
74
-
75
-
76
-
77
-
78
-
79
-
80
-
81
-
82
-
83
-
84
-
85
-
86
-
87
-
88
-
89
-
90
-
91
-
92
-
93
-
94
-
95
-
96
-
97
-
98
 |
 |

33 VONAGE ANNUAL REPORT 2013
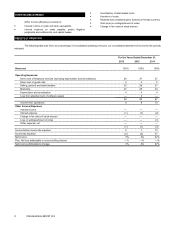
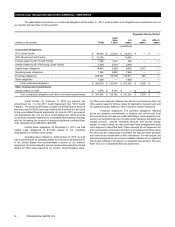
Selling, General and Administrative
For the years ended December 31,
Dollar
Change
2013 vs.
2012
Dollar
Change
2012 vs.
2011
Percent
Change
2013 vs.
2012
Percent
Change
2012 vs.
2011
(in thousands, except percentages) 2013 2012 2011
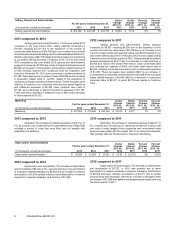
Selling, general and administrative $ 262,302 $ 242,368 $ 234,754 $ 19,934 $7,614 8% 3%
2013 compared to 2012
Selling, general and administrative. For the year ended 2013
compared to the year ended 2012, selling expense increased by
$12,641 including $3,701 due to the expansion of the number of
community sales teams, and $10,749 due to an increase in the number
of retail stores with assisted selling and the nationwide BasicTalk launch,
offset by a decrease of $2,158 related to product awareness advertising
of our mobile offering launched in February 2012. For the year ended
2013 compared to the year ended 2012, general and administrative
expense increased by $7,293 due mainly to higher share based cost of
$5,868, an increase in compensation and employee related expense of
$7,703 including expense from Vocalocity since the acquisition that
closed on November 15, 2013, and an increase in professional fees of
$1,798. There was also an increase in taxes of $2,082 and an increase
in acquisition related costs of $2,768 related to the acquisition of
Vocalocity, primarily related to professional fees. These increases were
offset by a resolution of an insurance claim for prior period legal fees
and settlement expenses of $2,300, lower customer care costs of
$7,145, and a decrease in telecommunications expenses of $1,100.
There was also a decrease in settlement cost of $972 and a decrease
in other expense of $1,122.
2012 compared to 2011
Selling, general and administrative. Selling expense
increased by $9,831 including $4,286 due to the expansion of the
number of community sales teams, $2,189 due to an increase in the
number of retail outlets with assisted selling, and $3,256 related to our
new mobile offering launched in February 2012 and our Digital Calling
Card launched in the fourth quarter of 2012. General and administrative
expense decreased by $2,217 due to a decrease in credit card fees of
$3,064 as a result of the Durbin Amendment, lower uncollected state
and municipal tax expense of $965, and lower share based cost of
$2,304, including a reversal of executive stock compensation expense
of $1,200. These decreases were partially offset by an increase in
compensation and benefits related expense of $3,669 driven by higher
salary related expense of $6,486 offset by a decrease in outsourced
temporary labor of $2,577, of which $2,118 was related to Customer
Care.
Marketing
For the years ended December 31,
Dollar
Change
2013 vs.
2012
Dollar
Change
2012 vs.
2011
Percent
Change
2013 vs.
2012
Percent
Change
2012 vs.
2011
(in thousands, except percentages) 2013 2012 2011
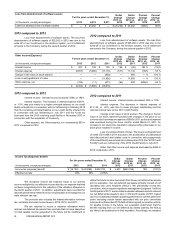
Marketing $ 227,052 $ 212,540 $ 204,263 $ 14,512 $8,277 7% 4%
2013 compared to 2012
Marketing. The increase in marketing expense of $14,512, or
7%, as a result of our investment for the nationwide launch of BasicTalk
including a portion of costs that were fixed and not variable with
subscriber line additions.
2012 compared to 2011
Marketing. The increase in marketing expense of $8,277, or
4%, resulted from increasing our marketing investment in direct mail
and retail to reach targeted ethnic segments and incremental media
expenses associated with the market test of our low-priced domestic
offer partially offset by the decrease in television advertising.
Depreciation and Amortization
For the years ended December 31, Dollar
Change
2013 vs.
2012
Dollar
Change
2012 vs.
2011
Percent
Change
2013 vs.
2012
Percent
Change
2012 vs.
2011
(in thousands, except percentages) 2013 2012 2011
Depreciation and amortization $36,066 $33,324 $37,051 $2,742 $ (3,727) 8% (10)%
2013 compared to 2012
Depreciation and amortization. The increase in depreciation
and amortization of $2,742, or 8%, was primarily due to the amortization
of acquisition-related intangibles of $2,483 and an increase in software
amortization of $1,553 partially offset by lower depreciation of network
equipment, computer hardware, and furniture of $1,295.
2012 compared to 2011
Depreciation and amortization. The decrease in depreciation
and amortization of $3,727, or 10%, was primarily due to lower
depreciation of network equipment, computer hardware, and furniture
of $2,356 and lower software amortization of $2,471 due to certain
projects being fully amortized, offset by an increase in intangible asset
amortization of $1,098 from additional intangible assets acquired during
the fourth quarter of 2011.
Table of Contents