Unilever 2008 Annual Report Download - page 4
Download and view the complete annual report
Please find page 4 of the 2008 Unilever annual report below. You can navigate through the pages in the report by either clicking on the pages listed below, or by using the keyword search tool below to find specific information within the annual report.-
 1
1 -
 2
2 -
 3
3 -
 4
4 -
 5
5 -
 6
6 -
 7
7 -
 8
8 -
 9
9 -
 10
10 -
 11
11 -
 12
12 -
 13
13 -
 14
14 -
 15
15 -
16
-
17
-
18
-
19
-
20
-
21
-
22
-
23
-
24
-
25
-
26
-
27
-
28
-
29
-
30
-
31
-
32
-
33
-
34
-
35
-
36
-
37
-
38
-
39
-
40
-
41
-
42
-
43
-
44
-
45
-
46
-
47
-
48
-
49
-
50
-
51
-
52
-
53
-
54
-
55
-
56
-
57
-
58
-
59
-
60
-
61
-
62
-
63
-
64
-
65
-
66
-
67
-
68
-
69
-
70
-
71
-
72
-
73
-
74
-
75
-
76
-
77
-
78
-
79
-
80
-
81
-
82
-
83
-
84
-
85
-
86
-
87
-
88
-
89
-
90
-
91
-
92
-
93
-
94
-
95
-
96
-
97
-
98
-
99
-
100
-
101
-
102
-
103
-
104
-
105
-
106
-
107
-
108
-
109
-
110
-
111
-
112
-
113
-
114
-
115
-
116
-
117
-
118
-
119
-
120
-
121
-
122
-
123
-
124
-
125
-
126
-
127
-
128
-
129
-
130
-
131
-
132
-
133
-
134
-
135
-
136
-
137
-
138
-
139
-
140
-
141
-
142
-
143
-
144
-
145
-
146
-
147
-
148
-
149
-
150
-
151
-
152
-
153
-
154
-
155
-
156
-
157
-
158
-
159
-
160
-
161
-
162
-
163
-
164
-
165
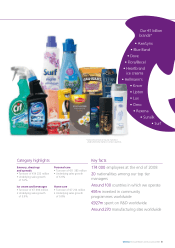
 |
 |

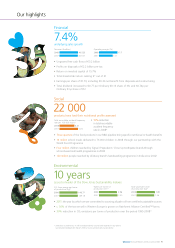
Operating margin (%)
2008 17.7
2007 13.1
Turnover (€ million)
2008 40 523
2007 40 187
Total recordable accident frequency
rate per 100 000 hours*
2008 0.21
0.26
2007
CO2 from energy per tonne
of production (kg)*
2008 146.77
2007 149.18
Total waste per tonne
of production (kg)*
2008 7.89
2007 7.56
Water per tonne of
production (m3)*
2008 2.96
2007 3.05
* 2008 data is preliminary. It will be independently assured and reported in our online
Sustainable Development Report 2008 at www.unilever.com/sustainability
Environmental
10 years
as sector leader of the Dow Jones Sustainability Indexes
• 2 0 1 5 : the year by which we are committed to sourcing all palm oil from certified sustainable sources
• c. 50% of the tea we sell in Western Europe is grown on Rainforest Alliance Certified™ farms
• 3 9 % reduction in CO2 emissions per tonne of production over the period 1995-2008*
Financial
7.4%
underlying sales growth
• Ungearedfreecashowof€3.2billion
• Protsondisposalsof€2.2billionpre-tax
• Returnoninvestedcapitalof15.7%
• Totalshareholderreturnranking9th out of 21
• Earningspershareof€1.79,including€0.36netbenetfromdisposalsandrestructuring
• Totaldividendincreasedto€0.77perOrdinary€0.16shareofNVand60.74pper
Ordinary 31/9p share of PLC
Social
22 000
products have had their nutritional profile assessed
• 1 9 % reduction
in total recordable
accident frequency
rate in 2008*
• Three quarters of the food products in our R&D pipeline bring specific nutritional or health benefits
• 16 million school meals delivered to 76 000 children in 2008 through our partnership with the
World Food Programme
• Four million children reached by Signal / Pepsodent / Close Up
toothpaste brands through
school-based oral health programmes in 2008
• 120 million people reached by Lifebuoy brand’s handwashing programme in India since 2002
Our highlights
Unilever Annual Report and Accounts 2008 1