Trend Micro 2014 Annual Report Download - page 3
Download and view the complete annual report
Please find page 3 of the 2014 Trend Micro annual report below. You can navigate through the pages in the report by either clicking on the pages listed below, or by using the keyword search tool below to find specific information within the annual report.-
 1
1 -
 2
2 -
 3
3 -
 4
4 -
 5
5 -
 6
6 -
 7
7 -
 8
8 -
 9
9 -
 10
10 -
 11
11 -
 12
12 -
 13
13 -
 14
14 -
15
-
16
-
17
-
18
-
19
-
20
-
21
-
22
-
23
-
24
-
25
-
26
-
27
-
28
-
29
-
30
-
31
-
32
-
33
-
34
-
35
-
36
-
37
-
38
-
39
-
40
-
41
-
42
-
43
-
44
-
45
-
46
-
47
-
48
-
49
-
50
-
51
 |
 |

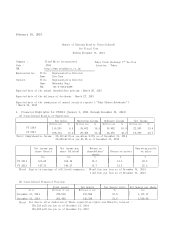
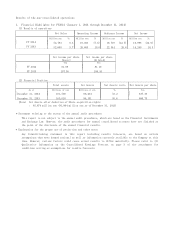
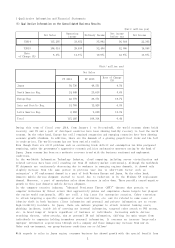
Results of the non-consolidated operations
1. Financial Highlights for FY2014 (January 1, 2014 through December 31, 2014)
(1) Results of operations
(2) Financial Position
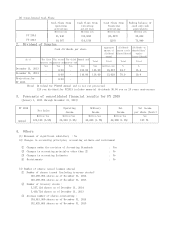
* Statement relating to the status of the annual audit procedures
This report is not subject to the annual audit procedures, which are based on the Financial Instruments
and Exchange Law. However, the audit procedures for annual consolidated accounts have not finished at
the point of the disclosure of the annual financial results.
* Explanation for the proper use of projection and other notes
Any forward-looking statement in this report including results forecasts, are based on certain
assumptions that were deemed rational as well as information currently available to the Company at this
time. However, various factors could cause actual results to differ materially. Please refer to (3)
Qualitative Information on the Consolidated Earnings Forecast on page 3 of the attachment for
conditions serving as assumptions for results forecasts.
Net Sales Operating Income Ordinary Income Net Income
Million yen % Million yen % Million yen % Million yen %
FY 2014 52,783 0.3 19,033 (7.6) 19,719 (12.5) 10,996 (22.9)
FY 2013 52,600 3.7 20,605 10.0 22,544 20.6 14,260 18.5
Net income per share
(basic)
Net income per share
(diluted)
Yen Yen
FY 2014 81.69 81.10
FY 2013 107.36 106.44
Total assets Net Assets Net Assets ratio Net Assets per share
As of Millions of yen Millions of yen % Yen
December 31, 2014 161,538 88,434 53.2 637.36
December 31, 2013 165,018 94,131 55.6 680.73
(Note) Net Assets after deduction of Share acquisition rights
: 85,874 million yen (91,804 million yen as of December 31, 2013)