Trend Micro 2014 Annual Report Download - page 1
Download and view the complete annual report
Please find page 1 of the 2014 Trend Micro annual report below. You can navigate through the pages in the report by either clicking on the pages listed below, or by using the keyword search tool below to find specific information within the annual report.-
 1
1 -
 2
2 -
 3
3 -
 4
4 -
 5
5 -
 6
6 -
 7
7 -
 8
8 -
 9
9 -
 10
10 -
 11
11 -
 12
12 -
13
-
14
-
15
-
16
-
17
-
18
-
19
-
20
-
21
-
22
-
23
-
24
-
25
-
26
-
27
-
28
-
29
-
30
-
31
-
32
-
33
-
34
-
35
-
36
-
37
-
38
-
39
-
40
-
41
-
42
-
43
-
44
-
45
-
46
-
47
-
48
-
49
-
50
-
51
 |
 |

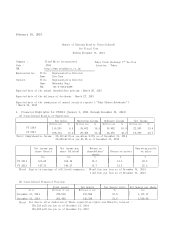
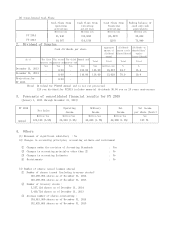
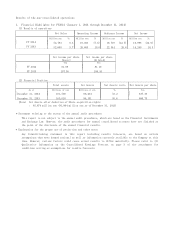
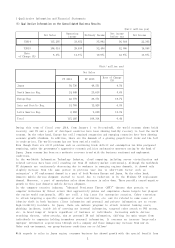
1. Financial Highlights for FY2014 (January 1, 2014 through December 31, 2014)
(1) Consolidated Results of Operations
(Note) Comprehensive Income : 28,415 million yen minus 0.8% as of December 31, 2014
28,648 million yen 43.3% as of December 31, 2013
February 18, 2015
Report of Earning Results (Consolidated)
for Fiscal Year
Ending December 31, 2014
Company : Trend Micro Incorporated Tokyo Stock Exchange 1st Section
Code : 4704 Location : Tokyo
URL http://www.trendmicro.co.jp/
Representative: Title Representative Director
Name Eva Chen
Contact: Title Representative Director
Name Mahendra Negi
TEL +81-3-5334-4899
Expected date of the annual shareholders meeting : March 26, 2015
Expected date of the delivery of dividends : March 27, 2015
Expected date of the submission of annual security reports (Yuka Shoken Hokokusho)
: March 30, 2015
Net Sales Operating Income Ordinary Income Net Income
Million yen % Million yen % Million yen % Million yen %
FY 2014 115,205 6.4 33,652 14.3 35,992 10.9 22,303 13.8
FY 2013 108,314 15.4 29,450 31.4 32,456 43.2 19,595 45.7
Net income per
share (basic)
Net income per
share (diluted)
Return on
shareholders'
equity
Return on assets
Operating profit
on sales
Yen Yen % % %
FY 2014 165.68 164.49 15.3 13.3 29.2
FY 2013 147.53 146.27 15.7 13.5 27.2
(Note) Equity in earnings of affiliated companies : 59 million yen loss as of December 31, 2014
1 million yen loss as of December 31, 2013
(2) Consolidated Financial Position
Total assets Net Assets Net Assets ratio Net Assets per share
As of Millions of yen Millions of yen % Yen
December 31, 2014 279,938 153,094 53.8 1,117.17
December 31, 2013 261,493 142,539 53.6 1,039.60
(Note) Net Assets after deduction of Share acquisition rights and Minority interest :
150,523 million yen as of December 31, 2014
140,202 million yen as of December 31, 2013