Trend Micro 2014 Annual Report Download
Download and view the complete annual report
Please find the complete 2014 Trend Micro annual report below. You can navigate through the pages in the report by either clicking on the pages listed below, or by using the keyword search tool below to find specific information within the annual report.-
 1
1 -
 2
2 -
 3
3 -
 4
4 -
 5
5 -
 6
6 -
 7
7 -
 8
8 -
 9
9 -
 10
10 -
 11
11 -
 12
12 -
13
-
14
-
15
-
16
-
17
-
18
-
19
-
20
-
21
-
22
-
23
-
24
-
25
-
26
-
27
-
28
-
29
-
30
-
31
-
32
-
33
-
34
-
35
-
36
-
37
-
38
-
39
-
40
-
41
-
42
-
43
-
44
-
45
-
46
-
47
-
48
-
49
-
50
-
51
 |
 |

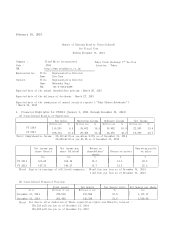
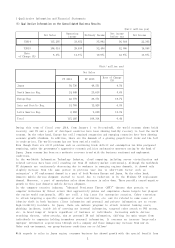
1. Financial Highlights for FY2014 (January 1, 2014 through December 31, 2014)
(1) Consolidated Results of Operations
(Note) Comprehensive Income : 28,415 million yen minus 0.8% as of December 31, 2014
28,648 million yen 43.3% as of December 31, 2013
February 18, 2015
Report of Earning Results (Consolidated)
for Fiscal Year
Ending December 31, 2014
Company : Trend Micro Incorporated Tokyo Stock Exchange 1st Section
Code : 4704 Location : Tokyo
URL http://www.trendmicro.co.jp/
Representative: Title Representative Director
Name Eva Chen
Contact: Title Representative Director
Name Mahendra Negi
TEL +81-3-5334-4899
Expected date of the annual shareholders meeting : March 26, 2015
Expected date of the delivery of dividends : March 27, 2015
Expected date of the submission of annual security reports (Yuka Shoken Hokokusho)
: March 30, 2015
Net Sales Operating Income Ordinary Income Net Income
Million yen % Million yen % Million yen % Million yen %
FY 2014 115,205 6.4 33,652 14.3 35,992 10.9 22,303 13.8
FY 2013 108,314 15.4 29,450 31.4 32,456 43.2 19,595 45.7
Net income per
share (basic)
Net income per
share (diluted)
Return on
shareholders'
equity
Return on assets
Operating profit
on sales
Yen Yen % % %
FY 2014 165.68 164.49 15.3 13.3 29.2
FY 2013 147.53 146.27 15.7 13.5 27.2
(Note) Equity in earnings of affiliated companies : 59 million yen loss as of December 31, 2014
1 million yen loss as of December 31, 2013
(2) Consolidated Financial Position
Total assets Net Assets Net Assets ratio Net Assets per share
As of Millions of yen Millions of yen % Yen
December 31, 2014 279,938 153,094 53.8 1,117.17
December 31, 2013 261,493 142,539 53.6 1,039.60
(Note) Net Assets after deduction of Share acquisition rights and Minority interest :
150,523 million yen as of December 31, 2014
140,202 million yen as of December 31, 2013
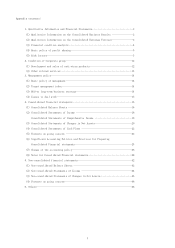
Table of contents
-
Page 1
..., 2015 Report of Earning Results (Consolidated) for Fiscal Year Ending December 31, 2014 Company : Code : URL Representative: Trend Micro Incorporated 4704 http://www.trendmicro.co.jp/ Tokyo Stock Exchange 1st Section Location : Tokyo Title Name Contact: Title Name TEL Expected date of the annual... -
Page 2
... of Surplus Cash dividends per share dividends on dividends payout ratio shareholders' equity (Consolidated) (consolidated) Total % Total % As of The first The second The third Annual end quarter end quarter end quarter end Yen Yen Yen Yen December 31, 2013 December 31, 2014 - 0.00 - 125... -
Page 3
...22.9) 18.5 Net income per share (basic) Yen Net income per share (diluted) Yen FY 2014 FY 2013 (2) Financial Position 81.69 107.36 81.10 106.44 Total assets As of Millions of yen Net Assets Millions of yen Net Assets ratio ï¼... Net Assets per share Yen December 31, 2014 161,538 88,434 53... -
Page 4
... Financial condition analysis 4 (4) Basic policy of profit sharing 5 (5) Risk factors 5 2. Condition of Corporate group 12 (1) Development and sales of anti-virus products 12 (2) Other related services 13 3. Management policy 14 (1) Basic policy of management 14 (2) Target management... -
Page 5
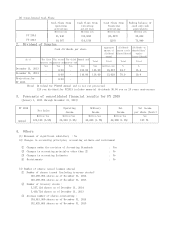
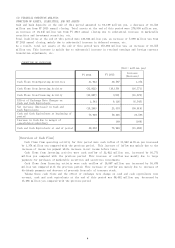
... 36,024 32,006 12.6ï¼... Net Income 22,303 19,595 13.8ï¼... (Unit: million yen) Net Sales FY 2014 Japan North America Reg. Europe Reg. Asia and Pacific Reg. Latin America Reg. Total 50,736 24,948 22,778 13,760 2,982 115,205 FY 2013 48,551 23,615 20,571 12,925 2,650 108,314 Rate of... -
Page 6
... increased in also local currency mainly due to cloud related business. In addition to weak yen, sales for this period in EMEA registered double digit growth of 22,778 million yen (10.7% increase from the same period in previous year). In the Asia Pacific region sales, especially Australia has been... -
Page 7
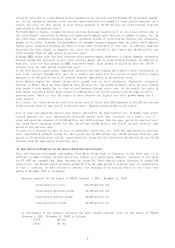
... of 18,445 million yen from FY 2013 annual closing due to substantial increase in marketable securities and investment securities, etc. Total liabilities at the end of this period were 126,844 million yen, an increase of 7,890 million yen from FY 2013 annual closing, mainly due to substantial... -
Page 8
...return profits to shareholders based on the net profit on a consolidated basis while striving to enhance financial strength and secure internal reserve in order to deal with significantly changing business environment and maintain competitive edge against competitors. As our basic policy on dividend... -
Page 9
... group belongs to, has grown increasingly competitive. Our existing competitors and other major vendors in the software and hardware industry etc. may start to offer antivirus and other computer security functions for free or at very low prices. Those antivirus and other computer security functions... -
Page 10
...unwanted spam, malicious web sites, and potentially dangerous programs. Our group's security products and services may also fail to properly identify and prevent unwanted emails, URLs, programs, malicious websites, or spyware that are often designed to circumvent anti-virus, anti-spam, web filtering... -
Page 11
...or programs are blocked by these our security products and services may seek redress against us for labeling them as spammers, malicious websites, spyware, or for interfering with their business. In addition, false identification of emails, URLs, or programs as unwanted spam, malicious web sites or... -
Page 12
... of Trend Micro Incorporated, Trend Micro group's parent company, could fall. Factors which could cause our quarterly financial results to fluctuate include: •timing of sales of our products and services to customers' budgetary constraints, seasonal buying patterns and our promotional activities... -
Page 13
... for download from our website. Should we fail to properly test these protection files and distribute a defective file, these files could cause damage to the personal computers of our customers who have downloaded a defective file. In addition, our hardware products as a defective appliance could... -
Page 14
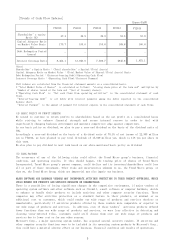
... PARENT COMPANY, IS VOLATILE, AND INVESTORS BUYING THE SHARES MAY NOT BE ABLE TO RESELL THEM AT OR ABOVE THEIR PURCHASE PRICE. Shares of the common stock of Trend Micro Incorporated, Trend Micro group's parent company, are traded on the Tokyo Stock Exchange. Recently, the Japanese securities markets... -
Page 15
...Trend Micro EMEA (GB) Limited(UK) Asia Pacific Trend Micro Incorporated(Taiwan) Trend Micro India Private Limited Trend Micro(China)Incorporated Trend Micro Australia Pty. Ltd. Latin America Sales of the products Japan North America Trend Micro do Brasil Ltda. Trend Micro Inc.(Japan) Trend Micro... -
Page 16
(2) Other related service Other related services are offered by Soft Trend Capital, which manages capital funds to be invested into Internet-related ventures and by General Mobile Corporation which provides total solutions for mobile device platform and mobile internet services. -
Page 17
...innovation in digital information traffic with easy, speedy, and reasonable for data mining and exchange to any information including big data. Under such a situation, the competition in the computer security market has changed, becoming more intensive with new entries. And our group recognizes that... -
Page 18
... a series of acquisitions and organically grown technology, Trend Micro has taken the lead over other competitors in creating cloud based security solution. Since 2009, Trend Micro Smart Protection Network is at the core of Trend Micro products and services. The past information society has been... -
Page 19
4. CONSOLIDATED FINANCIAL STATEMENTS (1) Consolidated Balance Sheets (Million yen) Account December 31, 2013 December 31, 2014 (Assets) Current assets Cash and bank deposits Notes and Accounts receivable, trade Marketable securities Inventories Deferred tax assets... -
Page 20
...18,386 21,796 113,509 (16,303) 137,389 1,768 (Million yen) December 31, 2014 (Liabilities) Current liabilities Accounts payable and Notes payable, trade Accounts payable, other Accrued expenses Accrued income and other taxes Allowance for bonuses Allowance for... -
Page 21
...Foreign exchange loss Equity in loss of affiliated companies Loss on disposal of fixed assets Other expenses Total non-operating expenses Ordinary income Extraordinary gain Gain on reversal of stock options Gain on sale of affiliated company securities Gain on change in... -
Page 22
... income Comprehensive income attributable to owners of the parent Comprehensive income attributable to minority interests (Million yen) For the year ended December 31, 2013 19,595 1,191 7,857 3 9,053 28,648 28,646 2 For the year ended December 31, 2014 22,303 477 5,533 101 6,112 28,415... -
Page 23
...137,389 (16,303) (16,857) 22,303 5,445 118,955 113,509 196 196 21,993 21,796 18,386 (Million yen) For the year ended December 31, 2014 18,386 Shareholders' equity Common stock Balance at the end of previous period Movement for the period Total movement Balance at the... -
Page 24
... Movement for the period Dividend of surplus Net income Increase due to deconsolidation Sales of treasury stock Purchase of treasury stock Movement for the period excluding shareholders'equity Total movement Balance at the end of current period 5,636... -
Page 25
... securities Payment for merger and acquisition Net cash used in/provided by investing activities Cash flows from financing activities: Payment for purchase of treasury stock Proceeds from sale of treasury stock Dividends paid Net cash used in financing activities Effect of exchange rate changes... -
Page 26
... Micro Australia Pty. Ltd. Trend Micro (EMEA) Limited (2) Unconsolidated subsidiaries Broadweb Corporation (Brunei) Itech Technology Limited(Brunei) Broadweb Corporation (Republic of Seychelles) Broadweb Corporation (China) Itech Technology Limited (China) Equity method accounting... -
Page 27
... inventory with lower profit margin is written down (2) Depreciation and amortization A. Property and equipment Mainly, depreciation is computed by declining-balance method in parent company and is computed by a straight-line method in consolidated subsidiaries. Useful lives of the main property and... -
Page 28
... currency denominated receivables and payables are translated into Japanese yen at period-end rates of exchange and the resulting translation gains or losses are taken into current income. All asset and liability accounts of foreign subsidiaries are translated into Japanese yen at Same as left -
Page 29
.... B. Revenue recognition method for Post Contract Customer Support Service Basically, the product license agreement contracted with the end-user states the article for PCS (customer support and upgrading of products and its pattern files). The company applies the following revenue recognition method... -
Page 30
...accumulated other comprehensive loss of JPY 749 million were recognized at the end of current fiscal year. Net asset per share was decreased by JPY 5.57. (Accounting Standards Not Yet Applied) (Accounting standard for retirement benefits - ASBJ Statement No.26, May 17, 2012 and ASBJ Guidance... -
Page 31
... 31, 2013) *1 Major components of Operating expenses are as follows Sales promotion 7,709 Salaries 27,623 Bonus 1,073 *2 Research and development expense were 4,182 millions of yen and included in Opearating expenses. (Millions of Yen) For the current fiscal year (From January 1, 2014 To... -
Page 32
...deferred tax amount of total other comprehensive income For the previous fiscal year (from January 1, 2013 to December 31, 2013) Valuation difference on available-for sales (Millions of Yen) securities 3,818 Amount incurred in current year Reclassification Before deferred tax Deferred tax... -
Page 33
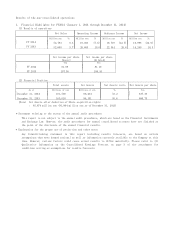
... year but the record date is in the current fiscal year Cash Total dividends Class of Dividends dividends Resolution (Millions of Record date Effective date stock resource per share yen) (yen) Shareholders' Retained meeting Common stock 16,857 125.00 Dec 31, 2013 Mar 27, 2014 earnings on Mar 26... -
Page 34
... yen) Stock Option 2,559 4. Dividend of surplus (1) Dividends payment Resolution Shareholders' meeting on Mar 26, 2014 Class of stock Common stock Total dividends (Millions of yen) 16,857 Cash dividends per share (yen) 125.00 Record date Dec 31, 2013 Effective date Mar 27, 2014 (2) Dividends... -
Page 35
...Cash and cash equivalent (Marketable securities and security investments) As of December 31, 2013 1 Available-for-sale investments with fair market value Fair value on Securities Marketable securities with fair value over purchase cost Bonds (1)Government bonds (2)Corporate bonds (3)Others Others... -
Page 36
...Available-for-sale investments with fair market value (Millions of yen) Securities Marketable securities with fair value over purchase cost Marketable securities with purchase cost over fair value Grand Total Bonds (1)Government bonds (2)Corporate bonds (3)Others Others Total Bonds... -
Page 37
... (2) The ratio of the Company's contribution for Kanto IT Software pension fund (as of Mar 31, 2013 1.05% (3) Supplemental information...service cost. (Millions of yen) At the end of current fiscal year (As of Dec 31, 2014) 1. Pension and severance plans The parent company has an unfunded retirement... -
Page 38
... income /loss before the effect of deferred income tax accounting Unrecognized actuarial gain / loss Total 905 905 (7)Plan ...yen. (1 Funded status of Kanto IT Software pension plan (as of Mar 31, 2014) Pension asset 252,293 Benefit obligation 227,330 Variance 24,963 (2) The ratio of the Company... -
Page 39
... and evaluating its business performances. The company is mainly engaged in developing and selling anti-virus software product and providing antivirus related services. The company is taking care of Japan area and its affiliates in North America, Europe, Asia Pacific or Latin America are in charge... -
Page 40
... other than Japan: North America Europe Asia pacific Latin America U.S.A., Canada Ireland, Germany, Italy, France, UK Taiwan, Korea, Australia, China, Philippines, Singapore, Malaysia, Thailand, India Brazil, Mexico North America 24,948 2,614 27,563 6,215 53,520 Europe Asia Pacific 13,760... -
Page 41
... of yen) Customer name SoftBank Telecom Corp. SoftBank BB Corp. Digital River, Inc. Sales 18,101 11,770 10,172 Segment Japan Japan Japan, North America, Europe, Asia Pacific For the current fiscal year (from January 1, 2014 to December 31, 2014) Information by production and service The amount... -
Page 42
...the previous fiscal year (from January 1, 2013 to December 31, 2013) Segment Japan Amortization Expense of GW Unamortized balance of GW 31 252 North America 301 758 Europe 6 56 Asia Pacific 3 51 Latin America (Millions of yen) Corporate adjustment Total or total Elimination 343 1,119 343 1,119 For... -
Page 43
... 31, 2014) Weighted-average number of 132,825,804 common shares (Shares) Adjustments to net income Millions of Yen) Increased numbers of common 1,143,309 shares (Shares) (Stock acquisition rights (1,143,309) (Shares)) Details of shares not 370,000 for Stock option round29... -
Page 44
...December 31, 2013) Total net assets Amount deducted from total net assets (Stock acquisition rights) (Minority interest) Total net assets attributable to common stock Number of common shares (Shares) (Millions of yen) For the current fiscal year (From January 1, 2014 To December 31, 2014) 153... -
Page 45
...Non-consolidated financial statements Non-consolidated Balance Sheets December 31, 2013 (Million yen) December 31, 2014 (1) Account (Assets) Current assets Cash and bank deposits Notes and Accounts receivable, trade Marketable securities Product Raw material... -
Page 46
... returns Deferred revenue Others Total current liabilities Non-current liabilities Deferred revenue Long-term account payable Allowance for retirement benefits Others Total non-current liabilities Total liabilities (Net assets) Shareholders' equity Common stock... -
Page 47
... Gross profit Operating expenses Operating income Non-operating income Interest income Interest on marketable securities Dividend Gain on sales of marketable securities Other income Total non-operating income Non-operating expenses Foreign exchange loss Loss... -
Page 48
(3) Non-consolidated Statements of Changes in Net Assets For the year ended December 31, 2013 18,386 ― 18,386 ― 18,386 (Million yen) For the year ended December 31, 2014 18,386 Shareholders' equity Common stock Balance at the end of previous period Movement for ... -
Page 49
... for the period Sales of treasury stock Purchase of treasury stock Total movement Balance at the end of current period Total shareholders' equity Balance at the end of previous period Movement for the period Dividend of surplus Net income Sales of... -
Page 50
For the year ended December 2013 (Millions of yen) For the year ended December 2014 573 1,191 1,191 1,764 1,764 Revaluation Surplus Unrealized gain/(loss) on available-for-sales securities Balance at the end of previous period Movement for the period 416 416 2,181... -
Page 51
(4) Footnote on going concern N/A 6. Others (1) Changes in Directors and Corporate Auditors (a) Representative Director N/A (b) Directors (Scheduled appointment date March,2015) Candidate for New Director Wael Mohamed (Group COO(present))