Texas Instruments 2009 Annual Report Download - page 17
Download and view the complete annual report
Please find page 17 of the 2009 Texas Instruments annual report below. You can navigate through the pages in the report by either clicking on the pages listed below, or by using the keyword search tool below to find specific information within the annual report.-
 1
1 -
2
-
3
-
4
-
5
-
6
-
 7
7 -
 8
8 -
 9
9 -
 10
10 -
 11
11 -
 12
12 -
 13
13 -
 14
14 -
 15
15 -
 16
16 -
 17
17 -
 18
18 -
 19
19 -
 20
20 -
 21
21 -
 22
22 -
 23
23 -
 24
24 -
 25
25 -
 26
26 -
 27
27 -
28
-
29
-
30
-
31
-
32
-
33
-
34
-
35
-
36
-
37
-
38
-
39
-
40
-
41
-
42
-
43
-
44
-
45
-
46
-
47
-
48
-
49
-
50
-
51
-
52
 |
 |

TEXAS INSTRUMENTS 2009 ANNUAL REPORT PAGE 15
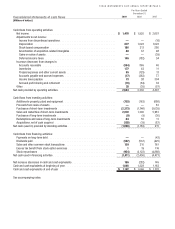
Effect on cash flows
Cash received from the exercise of options was $109 million in 2009, $210 million in 2008 and $761 million in 2007. The related net
tax impact realized was ($2) million, $31 million and $204 million (which includes excess tax benefits realized of $1 million, $19 million
and $116 million) in 2009, 2008 and 2007.
4. Profit sharing plans
Profit sharing benefits are generally formulaic and determined by one or more subsidiary or company-wide financial metrics. We pay
profit sharing benefits primarily under the company-wide TI Employee Profit Sharing Plan. This plan provides for profit sharing to be paid
based solely on TI’s operating margin for the full calendar year. Under this plan, TI must achieve a minimum threshold of 10 percent
operating margin before any profit sharing is paid. At 10 percent operating margin, profit sharing will be 2 percent of eligible payroll. The
maximum amount of profit sharing available under the plan is 20 percent of eligible payroll, which is paid only if TI’s operating margin is
at or above 35 percent for a full calendar year.
We recognized $102 million, $121 million and $180 million of profit sharing expense under the TI Employee Profit Sharing Plan in
2009, 2008 and 2007.
5. Income taxes
Income from continuing operations before income taxes U.S. Non-U.S. Total
2009 . . . . . . . . . . . . . . . . . . . . . . . . . . . . . . . . . . . . . . . . . . . . . . . . . . . . . . . . . . $1,375 $642 $2,017
2008 . . . . . . . . . . . . . . . . . . . . . . . . . . . . . . . . . . . . . . . . . . . . . . . . . . . . . . . . . . 1,749 732 2,481
2007 . . . . . . . . . . . . . . . . . . . . . . . . . . . . . . . . . . . . . . . . . . . . . . . . . . . . . . . . . . 2,738 954 3,692
Provision (benefit) for income taxes U.S. Federal Non-U.S. U.S. State Total
2009:
Current . . . . . . . . . . . . . . . . . . . . . . . . . . . . . . . . . . . . . . . . . . . . $334 $63 $ 4 $ 401
Deferred . . . . . . . . . . . . . . . . . . . . . . . . . . . . . . . . . . . . . . . . . . . 117 30 (1)146
Total . . . . . . . . . . . . . . . . . . . . . . . . . . . . . . . . . . . . . . . . . . . . . . . . $451 $93 $ 3 $ 547
2008:
Current. . . . . . . . . . . . . . . . . . . . . . . . . . . . . . . . . . . . . . . . . . . . . $646 $89 $ 8 $ 743
Deferred . . . . . . . . . . . . . . . . . . . . . . . . . . . . . . . . . . . . . . . . . . . . (214)43 (11)(182)
Total . . . . . . . . . . . . . . . . . . . . . . . . . . . . . . . . . . . . . . . . . . . . . . . . $432 $132 $(3) $ 561
2007:
Current. . . . . . . . . . . . . . . . . . . . . . . . . . . . . . . . . . . . . . . . . . . . . $823 $198 $(4) $ 1,017
Deferred . . . . . . . . . . . . . . . . . . . . . . . . . . . . . . . . . . . . . . . . . . . . (3)37 —34
Total . . . . . . . . . . . . . . . . . . . . . . . . . . . . . . . . . . . . . . . . . . . . . . . . $820 $235 $(4) $ 1,051
Principal reconciling items from income tax computed at the statutory federal rate follow:
2009 2008 2007
Computed tax at statutory rate . . . . . . . . . . . . . . . . . . . . . . . . . . . . . . . . . . . . . . . . $706 $868 $1,292
Effect of non-U.S. rates . . . . . . . . . . . . . . . . . . . . . . . . . . . . . . . . . . . . . . . . . . . . . (101)(197)(94)
Research and development tax credits. . . . . . . . . . . . . . . . . . . . . . . . . . . . . . . . . . . . (28)(75)(69)
U.S. tax benefits for manufacturing and foreign sales . . . . . . . . . . . . . . . . . . . . . . . . . . (21)(18)(24)
Other. . . . . . . . . . . . . . . . . . . . . . . . . . . . . . . . . . . . . . . . . . . . . . . . . . . . . . . . . (9)(17)(54)
Total provision for income taxes . . . . . . . . . . . . . . . . . . . . . . . . . . . . . . . . . . . . . . . . $547 $561 $1,051