Tesco 2008 Annual Report Download - page 98
Download and view the complete annual report
Please find page 98 of the 2008 Tesco annual report below. You can navigate through the pages in the report by either clicking on the pages listed below, or by using the keyword search tool below to find specific information within the annual report.-
 1
1 -
2
-
3
-
4
-
5
-
6
-
7
-
8
-
9
-
10
-
11
-
12
-
13
-
14
-
15
-
16
-
17
-
18
-
19
-
20
-
21
-
22
-
23
-
24
-
25
-
26
-
27
-
28
-
29
-
30
-
31
-
32
-
33
-
34
-
35
-
36
-
37
-
38
-
39
-
40
-
41
-
42
-
43
-
44
-
45
-
46
-
47
-
48
-
49
-
50
-
51
-
52
-
53
-
54
-
55
-
56
-
57
-
58
-
59
-
60
-
61
-
62
-
63
-
64
-
65
-
66
-
67
-
68
-
69
-
70
-
71
-
72
-
73
-
74
-
75
-
76
-
77
-
78
-
79
-
80
-
81
-
82
-
83
-
84
-
85
-
86
-
87
-
 88
88 -
 89
89 -
 90
90 -
 91
91 -
 92
92 -
 93
93 -
 94
94 -
 95
95 -
 96
96 -
 97
97 -
 98
98 -
 99
99 -
 100
100 -
 101
101 -
 102
102 -
 103
103 -
 104
104 -
 105
105 -
 106
106 -
 107
107 -
 108
108 -
109
-
110
-
111
-
112
 |
 |

Tesco PLC Annual Report and
Financial Statements 2008
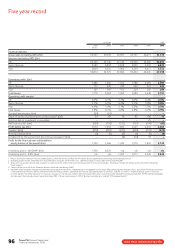
96
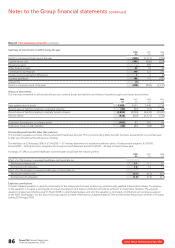
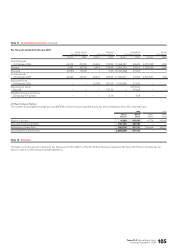
Five year record
UK GAAP IFRS
2004 2005 2005 200612007 2008
53 wks
Financial statistics
Group sales (including VAT) (£m) 33,557 37,070 36,957 43,137 46,611 51,773
Revenue (excluding VAT) (£m)
UK 24,760 27,146 27,146 29,990 32,665 34,874
Rest of Europe 3,385 3,818 3,818 5,095 5,559 6,872
Asia 2,669 3,010 2,902 4,369 4,417 5,552
30,814 33,974 33,866 39,454 42,641 47,298
Operating profit2(£m)
UK 1,486 1,666 1,556 1,788 2,083 2,097
Rest of Europe 171 249 243 263 324 400
Asia 121 149 153 229 241 294
Total Group 1,778 2,064 1,952 2,280 2,648 2,791
Operating profit margin2
UK 6.0% 6.1% 5.7% 6.0% 6.4% 6.0%
Rest of Europe 5.1% 6.5% 6.4% 5.2% 5.8% 5.8%
Asia 4.5% 5.0% 5.3% 5.2% 5.5% 5.3%
Total Group 5.8% 6.1% 5.8% 5.8% 6.2% 5.9%
Goodwill amortisation (£m) (54) (67) – – – –
Share of results of joint ventures and associates3(£m) 5969748210675
Profit on sale of investment in associates ––––25–
Net finance costs3(£m) (209) (136) (132) (127) (126) (63)
Profit before tax (£m) 1,574 1,930 1,894 2,235 2,653 2,803
Taxation3(£m) (472) (561) (541) (649) (772) (673)
Minority interests (£m) (2) (3) (3) (6) (7) (6)
(Loss)/profit for the period from discontinued operation4(£m) – – (6) (10) 18 –
Profit for the financial year attributable to
equity holders of the parent (£m) 1,100 1,366 1,344 1,570 1,892 2,124
Underlying profit – UK GAAP5(£m) 1,708 2,029 n/a n/a n/a n/a
Underlying profit – IFRS5(£m) n/a n/a 1,925 2,277 2,545 2,846
1 Results for the year ended 25 February 2006 include 52 weeks for the UK and ROI and 14 months for the majority of the remaining International businesses.
2 Operating profit includes integration costs and profit/(loss) arising on sale of fixed assets. Operating margin is based upon revenue excluding VAT.
3 Share of results of joint ventures and associates is stated net of the interest and tax of the Group’s joint ventures and associates. The Group’s charges for interest and tax have been reduced by
these amounts.
4 Consists of the net result of the Taiwanese business which was sold during 2006/7.
5 UK GAAP underlying profit excluded net profit/(loss) on disposal of fixed assets, integration costs and goodwill amortisation. IFRS underlying profit excludes IAS 32 and IAS 39 ‘Financial Instruments’
– Fair value remeasurements, the IAS 19 Income Statement charge, which is replaced by the ‘normal’ cash contributions for pensions, and IAS 17 ‘Leases’ – impact of annual uplifts in rent and
rent-free periods. For further details of this measure, see page 51. For the years 2004 to 2005 the above information is presented under UK GAAP as previously published. If IFRS had been applicable
for these years the main adjustments would have been IFRS 2 ‘Share-based payment’, IFRS 3 ‘Business Combinations’ and IAS 19 ‘Employee Benefits’.
www.tesco.com/annualreport08