Tesco 2008 Annual Report Download - page 47
Download and view the complete annual report
Please find page 47 of the 2008 Tesco annual report below. You can navigate through the pages in the report by either clicking on the pages listed below, or by using the keyword search tool below to find specific information within the annual report.-
 1
1 -
2
-
3
-
4
-
5
-
6
-
7
-
8
-
9
-
10
-
11
-
12
-
13
-
14
-
15
-
16
-
17
-
18
-
19
-
20
-
21
-
22
-
23
-
24
-
25
-
26
-
27
-
28
-
29
-
30
-
31
-
32
-
33
-
34
-
35
-
36
-
 37
37 -
 38
38 -
 39
39 -
 40
40 -
 41
41 -
 42
42 -
 43
43 -
 44
44 -
 45
45 -
 46
46 -
 47
47 -
 48
48 -
 49
49 -
 50
50 -
 51
51 -
 52
52 -
 53
53 -
 54
54 -
 55
55 -
 56
56 -
 57
57 -
58
-
59
-
60
-
61
-
62
-
63
-
64
-
65
-
66
-
67
-
68
-
69
-
70
-
71
-
72
-
73
-
74
-
75
-
76
-
77
-
78
-
79
-
80
-
81
-
82
-
83
-
84
-
85
-
86
-
87
-
88
-
89
-
90
-
91
-
92
-
93
-
94
-
95
-
96
-
97
-
98
-
99
-
100
-
101
-
102
-
103
-
104
-
105
-
106
-
107
-
108
-
109
-
110
-
111
-
112
 |
 |

Tesco PLC Annual Report and
Financial Statements 2008 45
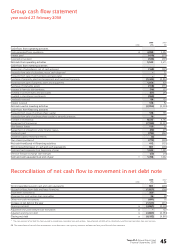
Group cash flow statement
year ended 23 February 2008
2008 2007
notes £m £m
Cash flows from operating activities
Cash generated from operations 29 4,099 3,532
Interest paid (410) (376)
Corporation tax paid (346) (545)
Net cash from operating activities 3,343 2,611
Cash flows from investing activities
Acquisition of subsidiaries, net of cash acquired (169) (325)
Proceeds from sale of subsidiary, net of cash disposed –22
Proceeds from sale of joint ventures and associates –41
Purchase of property, plant and equipment and investment property (3,442) (2,852)
Proceeds from sale of property, plant and equipment 1,056 809
Purchase of intangible assets (158) (174)
Increase in loans to joint ventures (36) (21)
Invested in joint ventures and associates (61) (49)
Invested in short-term investments (360) –
Dividends received 88 124
Interest received 128 82
Net cash used in investing activities (2,954) (2,343)
Cash flows from financing activities
Proceeds from issue of ordinary share capital 138 156
Proceeds from sale of ordinary share capital to minority interests 16 –
Increase in borrowings 9,333 4,743
Repayment of borrowings (7,593) (4,559)
New finance leases 119 99
Repayment of obligations under finance leases (32) (15)
Dividends paid (792) (467)
Dividends paid to minority interests (2) –
Own shares purchased (775) (490)
Net cash from/(used in) financing activities 412 (533)
Net increase/(decrease) in cash and cash equivalents 801 (265)
Cash and cash equivalents at beginning of year 1,042 1,325
Effect of foreign exchange rate changes (55) (18)
Cash and cash equivalents at end of year 17 1,788 1,042
Reconciliation of net cash flow to movement in net debt note
2008 2007
notes £m £m
Net increase/(decrease) in cash and cash equivalents 801 (265)
Net cash inflows from debt and lease financing (1,827) (268)
Short-term investments 360 –
Movement in joint venture loan receivables 36 38*
Other non-cash movements (691) 18
Increase in net debt in the year (1,321) (477)
Opening net debt 30 (4,861) (4,509)
Adjustment for joint venture loan receivables 30 –125*
Adjusted opening net debt 30 (4,861) (4,384)
Closing net debt 30 (6,182) (4,861)
* The measurement of net debt has been revised to include loans receivable from joint ventures. Going forward net debt will be stated inclusive of the loan receivables from joint ventures.
NB. The reconciliation of net cash flow to movement in net debt note is not a primary statement and does not form part of the cash flow statement.