Tesco 2008 Annual Report Download - page 78
Download and view the complete annual report
Please find page 78 of the 2008 Tesco annual report below. You can navigate through the pages in the report by either clicking on the pages listed below, or by using the keyword search tool below to find specific information within the annual report.-
 1
1 -
2
-
3
-
4
-
5
-
6
-
7
-
8
-
9
-
10
-
11
-
12
-
13
-
14
-
15
-
16
-
17
-
18
-
19
-
20
-
21
-
22
-
23
-
24
-
25
-
26
-
27
-
28
-
29
-
30
-
31
-
32
-
33
-
34
-
35
-
36
-
37
-
38
-
39
-
40
-
41
-
42
-
43
-
44
-
45
-
46
-
47
-
48
-
49
-
50
-
51
-
52
-
53
-
54
-
55
-
56
-
57
-
58
-
59
-
60
-
61
-
62
-
63
-
64
-
65
-
66
-
67
-
 68
68 -
 69
69 -
 70
70 -
 71
71 -
 72
72 -
 73
73 -
 74
74 -
 75
75 -
 76
76 -
 77
77 -
 78
78 -
 79
79 -
 80
80 -
 81
81 -
 82
82 -
 83
83 -
 84
84 -
 85
85 -
 86
86 -
 87
87 -
 88
88 -
89
-
90
-
91
-
92
-
93
-
94
-
95
-
96
-
97
-
98
-
99
-
100
-
101
-
102
-
103
-
104
-
105
-
106
-
107
-
108
-
109
-
110
-
111
-
112
 |
 |

Tesco PLC Annual Report and
Financial Statements 2008
76 www.tesco.com/annualreport08
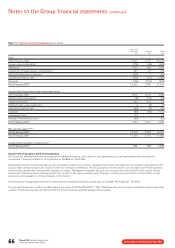
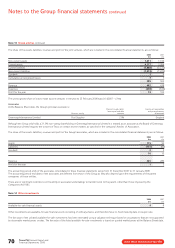
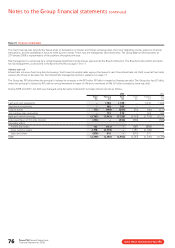
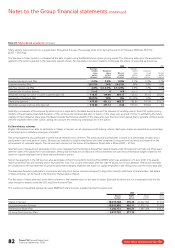
Note 21 Financial risk factors
The main financial risks faced by the Group relate to fluctuations in interest and foreign exchange rates, the risk of default by counter-parties to financial
transactions, and the availability of funds to meet business needs. These risks are managed as described below. The Group Balance Sheet position at
23 February 2008 is representative of the positions throughout the year.
Risk management is carried out by a central treasury department under policies approved by the Board of Directors. The Board provides written principles
for risk management, as described in the Business Review on pages 15 to 17.
Interest rate risk
Interest rate risk arises from long-term borrowings. Debt issued at variable rates exposes the Group to cash flow interest rate risk. Debt issued at fixed rates
exposes the Group to fair value risk. Our interest rate management policy is explained on page 17.
The Group has RPI debt where the principal is indexed to increases in the RPI index. RPI debt is treated as floating rate debt. The Group also has LPI debt,
where the principal is indexed to RPI, with an annual maximum increase of 5% and a minimum of 0%. LPI debt is treated as fixed rate debt.
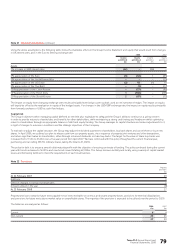
During 2008 and 2007, net debt was managed using derivative instruments to hedge interest rate risk as follows:
2008 2007
Fixed Floating Total Fixed Floating Total
£m £m £m £m £m £m
Cash and cash equivalents – 1,788 1,788 – 1,042 1,042
Short-term investments – 360 360 –––
Finance leases (73) (188) (261) (75) (96) (171)
Joint venture loan receivables – 173 173 – 163 163
Bank and other borrowings (5,745) (2,045) (7,790) (3,999) (1,518) (5,517)
Future purchases of minority interests (232) – (232) (306) – (306)
Derivative effect:
Interest rate swaps 752 (752) – 888 (888) –
Cross currency swaps 2,778 (2,778) – 1,180 (1,180) –
Caps and collars (876) 876 – (971) 971 –
To t a l (3,396) (2,566) (5,962) (3,283) (1,506) (4,789)
Notes to the Group financial statements continued