Tesco 2008 Annual Report Download - page 6
Download and view the complete annual report
Please find page 6 of the 2008 Tesco annual report below. You can navigate through the pages in the report by either clicking on the pages listed below, or by using the keyword search tool below to find specific information within the annual report.-
 1
1 -
 2
2 -
 3
3 -
 4
4 -
 5
5 -
 6
6 -
 7
7 -
 8
8 -
 9
9 -
 10
10 -
 11
11 -
 12
12 -
 13
13 -
 14
14 -
 15
15 -
 16
16 -
 17
17 -
18
-
19
-
20
-
21
-
22
-
23
-
24
-
25
-
26
-
27
-
28
-
29
-
30
-
31
-
32
-
33
-
34
-
35
-
36
-
37
-
38
-
39
-
40
-
41
-
42
-
43
-
44
-
45
-
46
-
47
-
48
-
49
-
50
-
51
-
52
-
53
-
54
-
55
-
56
-
57
-
58
-
59
-
60
-
61
-
62
-
63
-
64
-
65
-
66
-
67
-
68
-
69
-
70
-
71
-
72
-
73
-
74
-
75
-
76
-
77
-
78
-
79
-
80
-
81
-
82
-
83
-
84
-
85
-
86
-
87
-
88
-
89
-
90
-
91
-
92
-
93
-
94
-
95
-
96
-
97
-
98
-
99
-
100
-
101
-
102
-
103
-
104
-
105
-
106
-
107
-
108
-
109
-
110
-
111
-
112
 |
 |

Tesco PLC Annual Report and
Financial Statements 2008
4
Business Review continued
Group performance
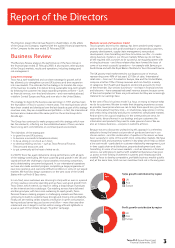
This year’s results represent very good progress across the Group and have been achieved by investing to improve the shopping experience for customers
in our businesses in the UK and around the world. We have been able to deliver another solid sales performance, and through good cost control and
productivity improvements, we have grown profits slightly faster than revenue – and thereby improved returns for shareholders. These improvements have
been achieved whilst continuing to invest in the long term – in the people, assets, processes and systems, which will enable Tesco to sustain its success in
the future.
Results These results are for the 52 weeks ended 23 February 2008, compared with the same period ending in February 2007. Results from our business
in China are consolidated in the full-year results for the first time.
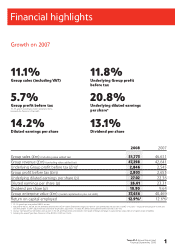
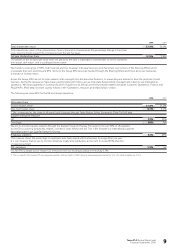
Group sales, including VAT, increased by 11.1% to £51.8bn (last year £46.6bn). At constant exchange rates, sales increased by 10.4%.
In April 2006, with our Preliminary Results for 2005/6, and following our transition to IFRS, we introduced an underlying profit measure, which excludes
the impact of the non-cash elements of IAS 19, IAS 32 and IAS 39 (principally pension costs and the marking to market of financial instruments). With
these Results, the underlying profit measure also excludes the impact of the non-cash element of IAS 17 ‘Leases’, relating to the impact of annual uplifts
in rent and rent free periods. Underlying profit before tax rose to £2,846m in the year (last year £2,545m), an increase of 11.8%.
With our Interim Results for 2006/7, we began reporting segmental trading profit, which excludes property profits and, as our underlying profit
measure does, excludes the non-cash element of the IAS 19 pension charge and now also excludes the non-cash element of the IAS 17 lease charge.
Group trading profits were £2,751m (last year £2,478m), up 11.0% on last year and Group trading margin, at 5.8%, was unchanged on last year.
Group operating profit rose by 5.4% to £2,791m (last year £2,648m). Within this, total net Group property profits were £188m in the year (last year
£139m, including asset disposals within joint ventures), comprising £186m in the UK and £2m in International. Group profit before tax increased 5.7%
to £2,803m (last year £2,653m). Excluding last year’s exceptional items; principally the Pensions A-Day credit, Group profit before tax rose 15.3% and
Group operating profit rose 15.1%.
Group results Actual rates Actual rates Constant
Group sales (inc. VAT) £51,773m 11.1% 10.4%
Group profit before tax £2,803m 5.7% 5.1%
Group operating profit £2,791m 5.4% 4.8%
Group underlying profit before tax £2,846m 11.8% 11.2%
Group trading profit £2,751m 11.0% 10.4%
Trading margin 5.8% – –
International Our International business delivered a very strong performance, contributing 54% of the growth in Group sales and 50% of the growth
in Group trading profit. Underlying margins improved whilst reported margins were diluted slightly by the consolidation of our business in China for the
first time, following the increase in our shareholding to 90% in December 2006.
Total International sales grew strongly – by 25.3% at actual exchange rates to £13.8bn (last year £11.0bn) and by 22.5% at constant exchange rates.
China contributed £702m to sales, representing 6.4 percentage points of the year’s total International growth at actual rates. Excluding China, total
international sales grew by 19.0% at actual rates and by 15.7% at constant rates. Like-for-like sales in International grew by 2.0%, with net new space
contributing the remaining 20.5%.
www.tesco.com/annualreport08
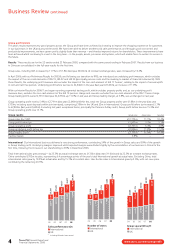
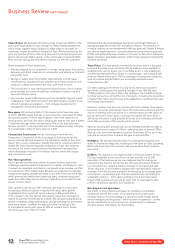
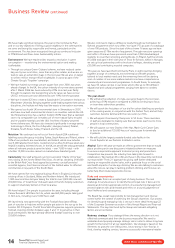
Group space 000 sq ft
International
UK
04 05 06 07 08
23,292
24,191
25,903
27,785
29,549
22,111
27,580
32,817
40,404
46,410
45,403
51,771
58,720
68,189
75,959
Number of stores
International
UK
04 05 06 07 08
1,877
1,779
1,897
1,988
2,115
441
586
814
1,275
1,614
2,318
2,365
2,711
3,263
3,729
Sales performance £m
International
UK
* Including 60 weeks International.
04 05 06*07 08
26,876
29,511
32,657
35,580
37,949
6,681
7,559
10,480
11,031
13,824
33,557
37,070
43,137
46,611
51,773