Sunoco 2012 Annual Report Download - page 9
Download and view the complete annual report
Please find page 9 of the 2012 Sunoco annual report below. You can navigate through the pages in the report by either clicking on the pages listed below, or by using the keyword search tool below to find specific information within the annual report.-
 1
1 -
 2
2 -
 3
3 -
 4
4 -
 5
5 -
 6
6 -
 7
7 -
 8
8 -
 9
9 -
 10
10 -
 11
11 -
 12
12 -
 13
13 -
 14
14 -
 15
15 -
 16
16 -
 17
17 -
 18
18 -
 19
19 -
 20
20 -
21
-
22
-
23
-
24
-
25
-
26
-
27
-
28
-
29
-
30
-
31
-
32
-
33
-
34
-
35
-
36
-
37
-
38
-
39
-
40
-
41
-
42
-
43
-
44
-
45
-
46
-
47
-
48
-
49
-
50
-
51
-
52
-
53
-
54
-
55
-
56
-
57
-
58
-
59
-
60
-
61
-
62
-
63
-
64
-
65
-
66
-
67
-
68
-
69
-
70
-
71
-
72
-
73
-
74
-
75
-
76
-
77
-
78
-
79
-
80
-
81
-
82
-
83
-
84
-
85
-
86
-
87
-
88
-
89
-
90
-
91
-
92
-
93
-
94
-
95
-
96
-
97
-
98
-
99
-
100
-
101
-
102
-
103
-
104
-
105
-
106
-
107
-
108
-
109
-
110
-
111
-
112
-
113
-
114
-
115
-
116
-
117
-
118
-
119
-
120
-
121
-
122
-
123
-
124
-
125
-
126
-
127
-
128
-
129
-
130
-
131
-
132
-
133
-
134
-
135
-
136
-
137
-
138
-
139
-
140
-
141
-
142
-
143
-
144
-
145
-
146
-
147
-
148
-
149
-
150
-
151
-
152
-
153
-
154
-
155
-
156
-
157
-
158
-
159
-
160
-
161
-
162
-
163
-
164
-
165
-
166
-
167
-
168
-
169
-
170
-
171
-
172
-
173
-
174
-
175
-
176
-
177
-
178
-
179
-
180
-
181
-
182
-
183
-
184
-
185
 |
 |

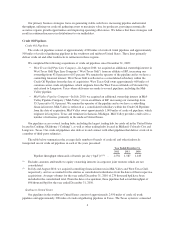
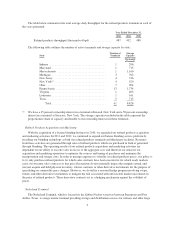
The following table shows our average daily volume for crude oil lease purchases and sales and other
exchanges and bulk purchases for the years presented:
Year Ended December 31,
2012 2011 2010
(in thousands of bpd)
Lease purchases:
Available for sale .................................... 283 215 181
Exchanged ......................................... 6 9 8
Other exchanges and bulk purchases ......................... 384 439 449
Total Purchases ......................................... 673 663 638
Bulk Sales ............................................. 342 281 250
Exchanges:
Purchased at the lease ................................ 6 9 8
Other ............................................. 321 370 382
Total Sales ............................................. 669 660 640
Crude Oil Price Volatility
Crude oil commodity prices have historically been volatile and cyclical. Profitability from our Crude Oil
Acquisition and Marketing segment is dependent on our ability to sell crude oil at prices in excess of our
aggregate cost. Our operations are not directly affected by the absolute level of crude oil prices, but are affected
by overall levels of supply and demand for crude oil and relative fluctuations in market related indices.
Generally, we expect a base level of earnings from our Crude Oil Acquisition and Marketing business, which
may be optimized and enhanced when there is a high level of market volatility. Integration between our crude oil
acquisition and marketing assets, crude oil pipelines and terminal facilities allows us to further improve upon
earnings during periods when there are favorable basis differentials between various types of crude oils.
Additionally, we are able to increase our base level of earnings when there is a steep contango or backwardated
market structure.
During periods when supply exceeds the demand for crude oil in the near term, the market for crude oil is
often in contango, meaning that the price of crude oil for future deliveries is higher than the price for current
deliveries. A contango market generally has a negative impact on our lease gathering margins, but is favorable to
commercial strategies associated with tankage. Access to our crude oil storage facilities during a contango
market allows us to improve our lease gathering margins by simultaneously purchasing crude oil inventories at
current prices for storage and selling forward at higher prices for future delivery.
When there is a higher demand than supply of crude oil in the near term, the market is backwardated,
meaning that the price of crude oil for future deliveries is lower than the price for current deliveries. A
backwardated market has a positive impact on our lease gathering margins because crude oil gatherers can
capture a premium for prompt deliveries. In this environment, there is little incentive to store crude oil, as current
prices are above delivery prices in the futures markets. In a backwardated market, increased lease gathering
margins provide an offset to reduced use of storage capacity.
The periods between a backwardated market and a contango market are referred to as transition periods.
Depending on the overall duration of these transition periods, how we have allocated our assets to particular
strategies and the time length of our crude oil purchase and sale contracts and storage lease agreements, these
transition periods may have either an adverse or beneficial effect on our aggregate segment profit. A prolonged
transition from a backwardated market to a contango market, or vice versa (essentially a market that is neither in
pronounced backwardation nor contango), represents the most difficult environment for our marketing activities.
7