Sunoco 2012 Annual Report Download - page 6
Download and view the complete annual report
Please find page 6 of the 2012 Sunoco annual report below. You can navigate through the pages in the report by either clicking on the pages listed below, or by using the keyword search tool below to find specific information within the annual report.-
 1
1 -
 2
2 -
 3
3 -
 4
4 -
 5
5 -
 6
6 -
 7
7 -
 8
8 -
 9
9 -
 10
10 -
 11
11 -
 12
12 -
 13
13 -
 14
14 -
 15
15 -
 16
16 -
 17
17 -
18
-
19
-
20
-
21
-
22
-
23
-
24
-
25
-
26
-
27
-
28
-
29
-
30
-
31
-
32
-
33
-
34
-
35
-
36
-
37
-
38
-
39
-
40
-
41
-
42
-
43
-
44
-
45
-
46
-
47
-
48
-
49
-
50
-
51
-
52
-
53
-
54
-
55
-
56
-
57
-
58
-
59
-
60
-
61
-
62
-
63
-
64
-
65
-
66
-
67
-
68
-
69
-
70
-
71
-
72
-
73
-
74
-
75
-
76
-
77
-
78
-
79
-
80
-
81
-
82
-
83
-
84
-
85
-
86
-
87
-
88
-
89
-
90
-
91
-
92
-
93
-
94
-
95
-
96
-
97
-
98
-
99
-
100
-
101
-
102
-
103
-
104
-
105
-
106
-
107
-
108
-
109
-
110
-
111
-
112
-
113
-
114
-
115
-
116
-
117
-
118
-
119
-
120
-
121
-
122
-
123
-
124
-
125
-
126
-
127
-
128
-
129
-
130
-
131
-
132
-
133
-
134
-
135
-
136
-
137
-
138
-
139
-
140
-
141
-
142
-
143
-
144
-
145
-
146
-
147
-
148
-
149
-
150
-
151
-
152
-
153
-
154
-
155
-
156
-
157
-
158
-
159
-
160
-
161
-
162
-
163
-
164
-
165
-
166
-
167
-
168
-
169
-
170
-
171
-
172
-
173
-
174
-
175
-
176
-
177
-
178
-
179
-
180
-
181
-
182
-
183
-
184
-
185
 |
 |

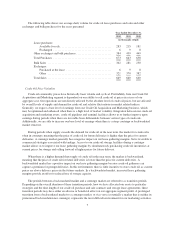
Our primary business strategies focus on generating stable cash flows, increasing pipeline and terminal
throughput, utilizing our crude oil gathering assets to maximize value for producers, pursuing economically
accretive organic growth opportunities and improving operating efficiencies. We believe that these strategies will
result in continued increases in distributions to our unitholders.
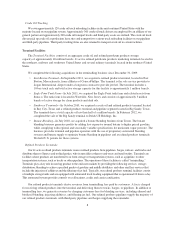
Crude Oil Pipelines
Crude Oil Pipelines
The crude oil pipelines consist of approximately 4,900 miles of crude oil trunk pipelines and approximately
500 miles of crude oil gathering pipelines in the southwest and midwest United States. These lines primarily
deliver crude oil and other feedstocks to refineries in those regions.
We completed the following acquisitions of crude oil pipelines since December 31, 2009:
•West Texas Gulf Pipe Line Company—In August 2010, we acquired an additional ownership interest in
West Texas Gulf Pipe Line Company (“West Texas Gulf”) from an affiliate of BP, increasing our
ownership from 43.8 percent to 60.3 percent. We remain the operator of the pipeline and as we have a
controlling financial interest, West Texas Gulf is reflected as a consolidated subsidiary within the
Crude Oil Pipelines from the date of acquisition. West Texas Gulf owns approximately 600 miles of
common carrier crude oil pipelines, which originate from the West Texas oil fields at Colorado City
and extend to Longview, Texas where deliveries are made to several pipelines, including the Mid-
Valley pipeline.
•Mid-Valley Pipeline Company—In July 2010, we acquired an additional ownership interest in Mid-
Valley Pipeline Company (“Mid-Valley”) from an affiliate of BP, increasing our ownership from
55.3 percent to 91.0 percent. We remain the operator of the pipeline and as we have a controlling
financial interest, Mid-Valley is reflected as a consolidated subsidiary within the Crude Oil Pipelines
from the date of acquisition. Mid-Valley owns approximately 1,000 miles of crude oil pipelines, which
originate in Longview, Texas and terminate in Samaria, Michigan. Mid-Valley provides crude oil to a
number of refineries, primarily in the midwest United States.
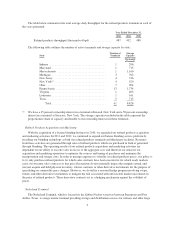
Our pipelines access several trading hubs, including the largest trading hub for crude oil in the United States
located in Cushing, Oklahoma (“Cushing”), as well as other trading hubs located in Midland, Colorado City and
Longview, Texas. Our crude oil pipelines also deliver to and connect with other pipelines that deliver crude oil to
a number of third-party refineries.
The table below summarizes the average daily number of barrels of crude oil and other feedstocks
transported on our crude oil pipelines in each of the years presented:
Year Ended December 31,
2012 2011 2010
Pipeline throughput (thousands of barrels per day (“bpd”))(1)(2) . . 1,556 1,587 1,183
(1) Excludes amounts attributable to equity ownership interests in corporate joint ventures which are not
consolidated.
(2) In July and August 2010, we acquired controlling financial interests in Mid-Valley and West Texas Gulf,
respectively, and we accounted for the entities as consolidated subsidiaries from the dates of their respective
acquisitions. Average volumes for the year ended December 31, 2010 of 278 thousand bpd have been
included in the consolidated total. From the dates of acquisition, these pipelines had actual throughput of
696 thousand bpd for the year ended December 31, 2010.
Southwest United States
Our pipelines in the southwest United States consist of approximately 2,950 miles of crude oil trunk
pipelines and approximately 300 miles of crude oil gathering pipelines in Texas. The Texas system is connected
4