Sunoco 2012 Annual Report Download - page 15
Download and view the complete annual report
Please find page 15 of the 2012 Sunoco annual report below. You can navigate through the pages in the report by either clicking on the pages listed below, or by using the keyword search tool below to find specific information within the annual report.-
 1
1 -
2
-
3
-
4
-
 5
5 -
 6
6 -
 7
7 -
 8
8 -
 9
9 -
 10
10 -
 11
11 -
 12
12 -
 13
13 -
 14
14 -
 15
15 -
 16
16 -
 17
17 -
 18
18 -
 19
19 -
 20
20 -
 21
21 -
 22
22 -
 23
23 -
 24
24 -
 25
25 -
26
-
27
-
28
-
29
-
30
-
31
-
32
-
33
-
34
-
35
-
36
-
37
-
38
-
39
-
40
-
41
-
42
-
43
-
44
-
45
-
46
-
47
-
48
-
49
-
50
-
51
-
52
-
53
-
54
-
55
-
56
-
57
-
58
-
59
-
60
-
61
-
62
-
63
-
64
-
65
-
66
-
67
-
68
-
69
-
70
-
71
-
72
-
73
-
74
-
75
-
76
-
77
-
78
-
79
-
80
-
81
-
82
-
83
-
84
-
85
-
86
-
87
-
88
-
89
-
90
-
91
-
92
-
93
-
94
-
95
-
96
-
97
-
98
-
99
-
100
-
101
-
102
-
103
-
104
-
105
-
106
-
107
-
108
-
109
-
110
-
111
-
112
-
113
-
114
-
115
-
116
-
117
-
118
-
119
-
120
-
121
-
122
-
123
-
124
-
125
-
126
-
127
-
128
-
129
-
130
-
131
-
132
-
133
-
134
-
135
-
136
-
137
-
138
-
139
-
140
-
141
-
142
-
143
-
144
-
145
-
146
-
147
-
148
-
149
-
150
-
151
-
152
-
153
-
154
-
155
-
156
-
157
-
158
-
159
-
160
-
161
-
162
-
163
-
164
-
165
-
166
-
167
-
168
-
169
-
170
-
171
-
172
-
173
-
174
-
175
-
176
-
177
-
178
-
179
-
180
-
181
-
182
-
183
-
184
-
185
 |
 |

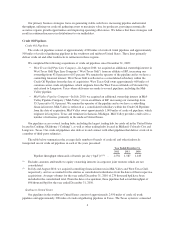
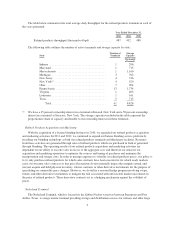
The following table shows the average shipments on the refined products pipelines in each of the years
presented. Average shipments represent the average revenue-generating pipeline throughput:
Year Ended
December 31,
2012 2011 2010
Pipeline throughput (thousands of bpd)(1)(2) ...................... 582 522 468
(1) Excludes amounts attributable to equity ownership interests in corporate joint ventures which are not
consolidated.
(2) In May 2011, we acquired a controlling financial interest in Inland and we accounted for the entity as a
consolidated subsidiary from the date of acquisition. Average volumes for the year ended December 31,
2011 of 88 thousand bpd have been included in the consolidated total. From the date of acquisition, this
pipeline had actual throughput of 140 thousand bpd for the year ended December 31, 2011.
The mix of refined products delivered varies seasonally, with gasoline demand peaking during the summer
months, and demand for heating oil and other distillate fuels peaking in the winter. In addition, weather
conditions in the areas served by the Refined Products Pipelines affect both the demand for, and the mix of, the
refined products delivered through the Refined Products Pipelines, although historically any overall impact on
the total volume shipped has been short term.
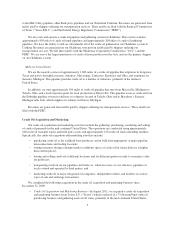
Joint Ventures
We own equity interests in several common carrier refined products pipelines, summarized in the following
table:
Pipeline
Equity
Ownership
Approximate
Pipeline
Mileage
Explorer Pipeline Company(1) .................... 9.4% 1,850
Yellowstone Pipe Line Company(2) ................ 14.0% 700
West Shore Pipe Line Company(3) ................ 17.1% 650
Wolverine Pipe Line Company(4) ................. 31.5% 700
(1) The system, which is operated by Explorer employees, originates from the refining centers of Lake Charles,
Louisiana and Beaumont, Port Arthur and Houston, Texas, and extends to Chicago, Illinois, with delivery
points in the Houston, Dallas/Fort Worth, Tulsa, St. Louis, and Chicago areas. Explorer charges market-
based rates for all its tariffs.
(2) The system, which is operated by Phillips 66, originates from the Billings, Montana refining center and
extends to Moses Lake, Washington with delivery points along the way. Tariff rates are regulated by the
FERC for interstate shipments and the Montana Public Service Commission for intrastate shipments in
Montana.
(3) The system, which is operated by Buckeye, originates from the Chicago, Illinois refining center and extends
to Madison and Green Bay, Wisconsin with delivery points along the way. West Shore charges market-
based tariff rates in the Chicago area.
(4) The system, which is operated by Wolverine employees, originates from Chicago, Illinois and extends to
Detroit, Grand Haven, and Bay City, Michigan with delivery points along the way. Wolverine charges
market-based rates for tariffs at the Detroit, Jackson, Niles, Hammond, and Lockport destinations.
Pipeline and Terminal Control Operations
Almost all of our refined products and crude oil pipelines are operated via satellite, microwave, and frame
relay communication systems from central control rooms located in Montello, Pennsylvania and Sugar Land,
13