Sunoco 2012 Annual Report Download - page 11
Download and view the complete annual report
Please find page 11 of the 2012 Sunoco annual report below. You can navigate through the pages in the report by either clicking on the pages listed below, or by using the keyword search tool below to find specific information within the annual report.-
 1
1 -
 2
2 -
 3
3 -
 4
4 -
 5
5 -
 6
6 -
 7
7 -
 8
8 -
 9
9 -
 10
10 -
 11
11 -
 12
12 -
 13
13 -
 14
14 -
 15
15 -
 16
16 -
 17
17 -
 18
18 -
 19
19 -
 20
20 -
 21
21 -
 22
22 -
23
-
24
-
25
-
26
-
27
-
28
-
29
-
30
-
31
-
32
-
33
-
34
-
35
-
36
-
37
-
38
-
39
-
40
-
41
-
42
-
43
-
44
-
45
-
46
-
47
-
48
-
49
-
50
-
51
-
52
-
53
-
54
-
55
-
56
-
57
-
58
-
59
-
60
-
61
-
62
-
63
-
64
-
65
-
66
-
67
-
68
-
69
-
70
-
71
-
72
-
73
-
74
-
75
-
76
-
77
-
78
-
79
-
80
-
81
-
82
-
83
-
84
-
85
-
86
-
87
-
88
-
89
-
90
-
91
-
92
-
93
-
94
-
95
-
96
-
97
-
98
-
99
-
100
-
101
-
102
-
103
-
104
-
105
-
106
-
107
-
108
-
109
-
110
-
111
-
112
-
113
-
114
-
115
-
116
-
117
-
118
-
119
-
120
-
121
-
122
-
123
-
124
-
125
-
126
-
127
-
128
-
129
-
130
-
131
-
132
-
133
-
134
-
135
-
136
-
137
-
138
-
139
-
140
-
141
-
142
-
143
-
144
-
145
-
146
-
147
-
148
-
149
-
150
-
151
-
152
-
153
-
154
-
155
-
156
-
157
-
158
-
159
-
160
-
161
-
162
-
163
-
164
-
165
-
166
-
167
-
168
-
169
-
170
-
171
-
172
-
173
-
174
-
175
-
176
-
177
-
178
-
179
-
180
-
181
-
182
-
183
-
184
-
185
 |
 |

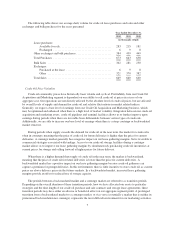
The table below summarizes the total average daily throughput for the refined products terminals in each of
the years presented:
Year Ended December 31,
2012 2011 2010
Refined products throughput (thousands of bpd) ............... 487 492 488
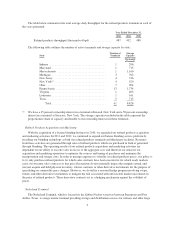
The following table outlines the number of active terminals and storage capacity by state:
State
Number of
Terminals
Storage
Capacity
(thousands
of barrels)
Indiana ........................................ 1 206
Maryland ...................................... 1 715
Massachusetts .................................. 1 1,160
Michigan ...................................... 3 762
New Jersey .................................... 4 746
New York(1) .................................... 4 920
Ohio .......................................... 7 904
Pennsylvania ................................... 13 1,734
Virginia ....................................... 1 403
Louisiana ...................................... 1 161
Texas ......................................... 5 715
Total ...................................... 41 8,426
(1) We have a 45 percent ownership interest in a terminal at Inwood, New York and a 50 percent ownership
interest in a terminal at Syracuse, New York. The storage capacities included in the table represent the
proportionate share of capacity attributable to our ownership interests in these terminals.
Refined Products Acquisition and Marketing
With the acquisition of a butane blending business in 2010, we expanded our refined products acquisition
and marketing activities. In 2011 and 2012, we continued to expand our butane blending service platform by
installing our blending technology at both our refined products terminals and third-party facilities. Revenues
from these activities are generated through sales of refined products which are purchased in bulk or generated
through blending. The operating results of our refined products acquisition and marketing activities are
dependent on our ability to execute sales in excess of the aggregate cost, and therefore we structure our
acquisition and marketing operations to optimize the sources and timing of purchases and minimize the
transportation and storage costs. In order to manage exposure to volatility in refined products prices, our policy is
to (i) only purchase refined products for which sales contracts have been executed or for which ready markets
exist, (ii) structure sales contracts so that price fluctuations do not materially impact the margins earned, and
(iii) not acquire and hold physical inventory, futures contracts or other derivative instruments for the purpose of
speculating on commodity price changes. However, we do utilize a seasonal hedge program involving swaps,
futures and other derivative instruments to mitigate the risk associated with unfavorable market movements in
the price of refined products. These derivative contracts act as a hedging mechanism against the volatility of
prices.
Nederland Terminal
The Nederland Terminal, which is located on the Sabine-Neches waterway between Beaumont and Port
Arthur, Texas, is a large marine terminal providing storage and distribution services for refiners and other large
9