Southwest Airlines 1997 Annual Report Download - page 1
Download and view the complete annual report
Please find page 1 of the 1997 Southwest Airlines annual report below. You can navigate through the pages in the report by either clicking on the pages listed below, or by using the keyword search tool below to find specific information within the annual report.-
 1
1 -
 2
2 -
 3
3 -
 4
4 -
 5
5 -
 6
6 -
 7
7 -
 8
8 -
 9
9 -
 10
10 -
 11
11 -
 12
12 -
13
-
14
-
15
-
16
-
17
-
18
-
19
-
20
-
21
-
22
-
23
-
24
-
25
-
26
-
27
-
28
-
29
-
30
-
31
-
32
-
33
-
34
-
35
-
36
-
37
-
38
-
39
-
40
-
41
-
42
-
43
-
44
-
45
-
46
-
47
-
48
-
49
-
50
-
51
-
52
-
53
-
54
-
55
-
56
-
57
-
58
 |
 |

SOUTHWEST AIRLINES CO. ♥ FIVE SYMBOLS OF FREEDOM
TABLE OF CONTENTS
Consolidated Highlights ....................................................................................... 1
Preamble .............................................................................................................. 3
Letter to Shareholders.......................................................................................... 4
First Symbol of Freedom ...................................................................................... 6
Second Symbol of Freedom ................................................................................. 9
Third Symbol of Freedom................................................................................... 12
Fourth Symbol of Freedom................................................................................. 15
Fifth Symbol of Freedom .................................................................................... 18
Future of Freedom.............................................................................................. 21
Destinations........................................................................................................ 24
Triple Crown One ............................................................................................... 25
Financial Review ................................................................................................ 26
Management’s Discussion and Analysis ............................................................ 26
Consolidated Financial Statements.................................................................... 36
Report of Independent Auditors ......................................................................... 51
Quarterly Financial Data .................................................................................... 52
Common Stock Price Ranges and Dividends..................................................... 52
Ten-Year Summary ............................................................................................ 53
Corporate Data................................................................................................... 55
Directors and Officers......................................................................................... 56
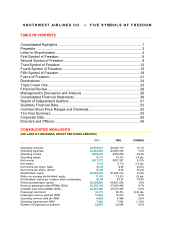
CONSOLIDATED HIGHLIGHTS
(DOLLARS IN THOUSANDS, EXCEPT PER SHARE AMOUNTS)
1997 1996 CHANGE
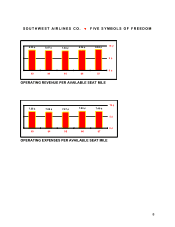
Operating revenues $3,816,821 $3,406,170 12.1%
Operating expenses $3,292,585 $3,055,335 7.8%
Operating income $524,236 $350,835 49.4%
Operating margin 13.7% 10.3% 3.4 pts.
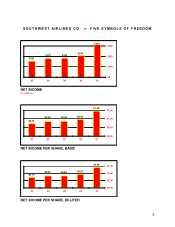
Net income $317,772 $207,337 53.3%
Net margin 8.3% 6.1% 2.2 pts.
Net income per share, basic $1.45 $.95 52.6%
Net income per share, diluted $1.40 $.92 52.2%
Stockholders’ equity $2,009,018 $1,648,312 21.9%
Return on average stockholders’ equity 17.4% 13.5% 3.9 pts.
Stockholders’ equity per common share outstanding $9.08 $7.57 19.9%
Revenue passengers carried 50,399,960 49,621,504 1.6%
Revenue passenger miles (RPMs) (000s) 28,355,169 27,083,483 4.7%
Available seat miles (ASMs) (000s) 44,487,496 40,727,495 9.2%
Passenger load factor 63.7% 66.5% (2.8) pts.
Passenger revenue yield per RPM 12.84¢12.07¢6.4%
Operating revenue yield per ASM 8.58¢8.36¢2.6%
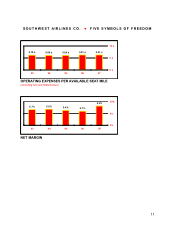
Operating expenses per ASM 7.40¢7.50¢(1.3)%
Number of Employees at yearend 23,974 22,944 4.5%