Shutterfly 2013 Annual Report Download - page 76
Download and view the complete annual report
Please find page 76 of the 2013 Shutterfly annual report below. You can navigate through the pages in the report by either clicking on the pages listed below, or by using the keyword search tool below to find specific information within the annual report.-
 1
1 -
2
-
3
-
4
-
5
-
6
-
7
-
8
-
9
-
10
-
11
-
12
-
13
-
14
-
15
-
16
-
17
-
18
-
19
-
20
-
21
-
22
-
23
-
24
-
25
-
26
-
27
-
28
-
29
-
30
-
31
-
32
-
33
-
34
-
35
-
36
-
37
-
38
-
39
-
40
-
41
-
42
-
43
-
44
-
45
-
46
-
47
-
48
-
49
-
50
-
51
-
52
-
53
-
54
-
55
-
56
-
57
-
58
-
59
-
60
-
61
-
62
-
63
-
64
-
65
-
 66
66 -
 67
67 -
 68
68 -
 69
69 -
 70
70 -
 71
71 -
 72
72 -
 73
73 -
 74
74 -
 75
75 -
 76
76 -
 77
77 -
 78
78 -
 79
79 -
 80
80 -
 81
81 -
 82
82 -
 83
83 -
 84
84 -
 85
85 -
 86
86 -
87
-
88
-
89
-
90
-
91
-
92
-
93
-
94
-
95
-
96
-
97
-
98
-
99
-
100
-
101
-
102
-
103
-
104
-
105
-
106
-
107
-
108
-
109
-
110
-
111
-
112
-
113
-
114
-
115
-
116
-
117
-
118
-
119
-
120
-
121
-
122
-
123
-
124
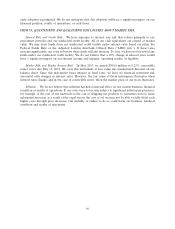
 |
 |
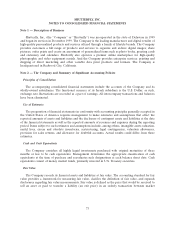
participants at the reporting date. The accounting standard establishes a three-tier hierarchy, which
prioritizes the inputs used in the valuation methodologies in measuring fair value:
Level 1 – Quoted prices in active markets for identical assets or liabilities
Level 2 – Inputs other than Level 1 that are observable, either directly or indirectly, such as quoted prices
for similar assets or liabilities; quoted prices in markets that are not active; or other inputs that are
observable or can be corroborated by observable market data for substantially the full term of the assets or
liabilities.
Level 3 – Unobservable inputs that are supported by little or no market activity and that are significant to
the fair value of the assets or liabilities.
As of December 31, 2013 and 2012, the Company had cash of $499.1 million and $186.3 million,
respectively, and cash equivalents in 2012 of $58.8 million which are classified in the Level 1 hierarchy. The
fair value of the Company’s convertible senior notes is classified in the Level 2 hierarchy. The Company
has no Level 3 assets or liabilities.
Concentration of Credit Risk
Financial instruments that potentially subject the Company to credit risk consist principally of cash,
cash equivalents, and accounts receivable. As of December 31, 2013, the Company’s cash and cash
equivalents were maintained by financial institutions in the United States and its deposits may be in excess
of insured limits. The Company believes that the financial institutions that hold its investments are
financially sound and, accordingly, minimal credit risk exists with respect to these investments.
The Company’s accounts receivable are derived primarily from sales to customers located in the
United States who make payments through credit cards, sales of the Company’s products in retail stores,
sales of enterprise services, and revenue generated from online advertisements posted on the Company’s
websites. Credit card receivables settle relatively quickly and the Company’s historical experience of credit
card losses have not been material and have been within management’s expectations. Excluding amounts
due from credit cards of customers, as of December 31, 2013, one Enterprise customer accounted for 28%
of the Company’s net accounts receivable. No other customers accounted for more than 10% of net
accounts receivable as of December 31, 2013. As of December 31, 2012, two Enterprise customers
accounted for 26% and 12% of the Company’s net accounts receivable, respectively. No other customers
accounted for more than 10% of net accounts receivable as of December 31, 2012.
Inventories
Inventories are stated at the lower of cost on a first-in, first-out basis or net realizable value. The value
of inventories is reduced by estimates for excess and obsolete inventories. The estimate for excess and
obsolete inventories is based upon management’s review of utilization of inventories in light of projected
sales, current market conditions and market trends. Inventories are primarily raw materials and consist
principally of paper, photo book covers and packaging supplies.
Deferred Costs
Deferred costs are the incremental costs directly associated with flash deal promotions through group
buying websites. These costs are paid and deferred at the time of the flash deal, and recognized when the
redeemed products are shipped. Amortization of deferred costs is included in sales and marketing expense
in the accompanying consolidated statements of income.
74