Shutterfly 2013 Annual Report Download - page 63
Download and view the complete annual report
Please find page 63 of the 2013 Shutterfly annual report below. You can navigate through the pages in the report by either clicking on the pages listed below, or by using the keyword search tool below to find specific information within the annual report.-
 1
1 -
2
-
3
-
4
-
5
-
6
-
7
-
8
-
9
-
10
-
11
-
12
-
13
-
14
-
15
-
16
-
17
-
18
-
19
-
20
-
21
-
22
-
23
-
24
-
25
-
26
-
27
-
28
-
29
-
30
-
31
-
32
-
33
-
34
-
35
-
36
-
37
-
38
-
39
-
40
-
41
-
42
-
43
-
44
-
45
-
46
-
47
-
48
-
49
-
50
-
51
-
52
-
 53
53 -
 54
54 -
 55
55 -
 56
56 -
 57
57 -
 58
58 -
 59
59 -
 60
60 -
 61
61 -
 62
62 -
 63
63 -
 64
64 -
 65
65 -
 66
66 -
 67
67 -
 68
68 -
 69
69 -
 70
70 -
 71
71 -
 72
72 -
 73
73 -
74
-
75
-
76
-
77
-
78
-
79
-
80
-
81
-
82
-
83
-
84
-
85
-
86
-
87
-
88
-
89
-
90
-
91
-
92
-
93
-
94
-
95
-
96
-
97
-
98
-
99
-
100
-
101
-
102
-
103
-
104
-
105
-
106
-
107
-
108
-
109
-
110
-
111
-
112
-
113
-
114
-
115
-
116
-
117
-
118
-
119
-
120
-
121
-
122
-
123
-
124
 |
 |

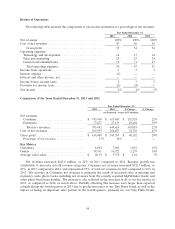
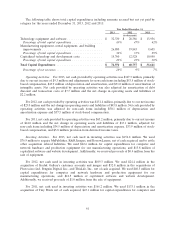
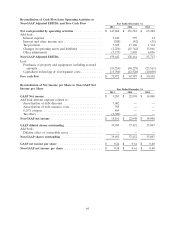
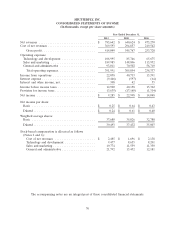
The following table shows total capital expenditures including amounts accrued but not yet paid by
category for the years ended December 31, 2013, 2012 and 2011:
Year Ended December 31,
2013 2012 2011
(in thousands)
Technology equipment and software .................... $ 32,330 $ 28,386 $ 13,956
Percentage of total capital expenditures ................. 43% 47% 42%
Manufacturing equipment, rental equipment, and building
improvements .................................. 26,880 19,843 9,605
Percentage of total capital expenditures ................. 36% 33% 29%
Capitalized technology and development costs ............ 15,760 12,528 10,050
Percentage of total capital expenditures ................. 21% 21% 30%
Total Capital Expenditures .......................... $ 74,970 $ 60,757 $ 33,611
Percentage of net revenues .......................... 10% 9% 7%
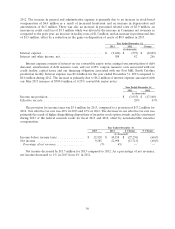
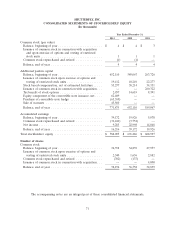
Operating Activities. For 2013, net cash provided by operating activities was $147.3 million, primarily
due to our net income of $9.3 million and adjustments for non-cash items including $53.5 million of stock-
based compensation, $43.9 million of depreciation and amortization, and $31.0 million of amortization of
intangible assets. Net cash provided by operating activities was also adjusted for amortization of debt
discount and transaction costs of $7.7 million and the net change in operating assets and liabilities of
$2.2 million.
For 2012, net cash provided by operating activities was $151.4 million, primarily due to our net income
of $23.0 million and the net change in operating assets and liabilities of $43.8 million. Net cash provided by
operating activities was adjusted for non-cash items including $50.1 million of depreciation and
amortization expense and $37.3 million of stock-based compensation.
For 2011, net cash provided by operating activities was $63.2 million, primarily due to our net income
of $14.0 million and the net change in operating assets and liabilities of $13.1 million, adjusted for
non-cash items including $34.5 million of depreciation and amortization expense, $33.9 million of stock-
based compensation, and $5.8 million provision from deferred income taxes.
Investing Activities. For 2013, net cash used in investing activities was $154.8 million. We used
$76.9 million to acquire MyPublisher, R&R Images, and BorrowLenses, net of cash acquired, and to settle
other acquisition related liabilities. We used $62.6 million for capital expenditures for computer and
network hardware and production equipment for our manufacturing operations, and $15.8 million of
capitalized software and website development. Additionally, we received proceeds of $0.4 million from the
sale of equipment.
For 2012, net cash used in investing activities was $109.3 million. We used $24.4 million in the
acquisition of Kodak Gallery’s customer accounts and images and $32.8 million in the acquisitions of
Photoccino Ltd, Penguin Digital, Inc., and ThisLife, Inc., net of cash acquired. We used $40.5 million for
capital expenditures for computer and network hardware and production equipment for our
manufacturing operations, and $12.5 million of capitalized software and website development.
Additionally, we received proceeds of $1.0 million from the sale of equipment.
For 2011, net cash used in investing activities was $166.2 million. We used $133.1 million in the
acquisition of Tiny Prints net of cash acquired, $23.1 million for capital expenditures for computer and
61