Shutterfly 2013 Annual Report Download - page 61
Download and view the complete annual report
Please find page 61 of the 2013 Shutterfly annual report below. You can navigate through the pages in the report by either clicking on the pages listed below, or by using the keyword search tool below to find specific information within the annual report.-
 1
1 -
2
-
3
-
4
-
5
-
6
-
7
-
8
-
9
-
10
-
11
-
12
-
13
-
14
-
15
-
16
-
17
-
18
-
19
-
20
-
21
-
22
-
23
-
24
-
25
-
26
-
27
-
28
-
29
-
30
-
31
-
32
-
33
-
34
-
35
-
36
-
37
-
38
-
39
-
40
-
41
-
42
-
43
-
44
-
45
-
46
-
47
-
48
-
49
-
50
-
 51
51 -
 52
52 -
 53
53 -
 54
54 -
 55
55 -
 56
56 -
 57
57 -
 58
58 -
 59
59 -
 60
60 -
 61
61 -
 62
62 -
 63
63 -
 64
64 -
 65
65 -
 66
66 -
 67
67 -
 68
68 -
 69
69 -
 70
70 -
 71
71 -
72
-
73
-
74
-
75
-
76
-
77
-
78
-
79
-
80
-
81
-
82
-
83
-
84
-
85
-
86
-
87
-
88
-
89
-
90
-
91
-
92
-
93
-
94
-
95
-
96
-
97
-
98
-
99
-
100
-
101
-
102
-
103
-
104
-
105
-
106
-
107
-
108
-
109
-
110
-
111
-
112
-
113
-
114
-
115
-
116
-
117
-
118
-
119
-
120
-
121
-
122
-
123
-
124
 |
 |

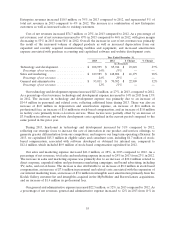
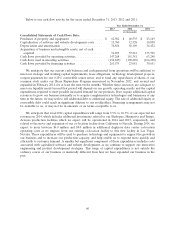
professional fees of $0.7 million which are largely due to transaction costs related to our acquisition of Tiny
Prints incurred in 2011, and gains on disposition of assets of $0.6 million in 2012.
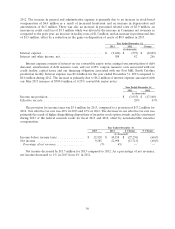
Year Ended December 31,
2012 2011 Change
(in thousands)
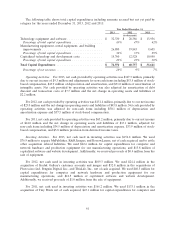
Interest expense .................................. $ (597) $ (64) $ (533)
Interest and other income, net ........................ 42 35 7
Interest expense increased in 2012 compared to 2011 primarily due to origination and ongoing
commitment fees from our five-year syndicated credit facility that became effective in November 2011.
Year Ended December 31,
2012 2011
(in thousands)
Income tax provision ......................................... $ (17,160) $ (1,314)
Effective tax rate ........................................... 43% 9%
The provision for income taxes was $17.2 million for 2012, compared to a provision of $1.3 million for
2011. Our effective tax rate was 43% in 2012 and 9% in 2011. This increase in our effective tax rate was
primarily the result of fewer disqualifying dispositions of incentive stock option awards in the current year,
a delay in the extension of the federal research credit, and a valuation allowance on certain California
deferred tax assets.
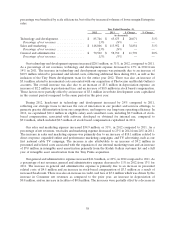
Year Ended December 31,
2012 2011 $ Change % Change
(in thousands)
Income before income taxes ............... $ 40,158 $ 15,362 $ 24,796 161%
Net income ........................... 22,998 14,048 8,950 64%
Percentage of net revenues ................ 4% 3% ——
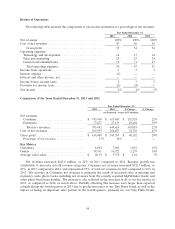
Net income increased by $9.0 million for 2012 compared to 2011. As a percentage of net revenues, net
income increased to 4% in 2012 from 3% in 2011.
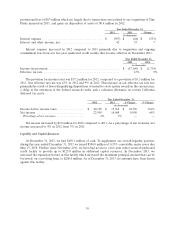
Liquidity and Capital Resources
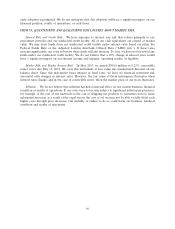
At December 31, 2013, we had $499.1 million of cash. To supplement our overall liquidity position,
during the year ended December 31, 2013 we issued $300.0 million of 0.25% convertible senior notes due
May 15, 2018. Further, since November 2011, we have had access to a five-year senior secured syndicated
credit facility to provide up to $125.0 million in additional capital resources. In December 2013, we
exercised the expansion feature in this facility which increased the maximum principal amount that can be
borrowed, on a revolving basis, to $200.0 million. As of December 31, 2013, no amounts have been drawn
against this facility.
59