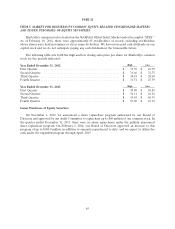
Shutterfly 2013 Annual Report Download - page 48
Download and view the complete annual report
Please find page 48 of the 2013 Shutterfly annual report below. You can navigate through the pages in the report by either clicking on the pages listed below, or by using the keyword search tool below to find specific information within the annual report.-
 1
1 -
2
-
3
-
4
-
5
-
6
-
7
-
8
-
9
-
10
-
11
-
12
-
13
-
14
-
15
-
16
-
17
-
18
-
19
-
20
-
21
-
22
-
23
-
24
-
25
-
26
-
27
-
28
-
29
-
30
-
31
-
32
-
33
-
34
-
35
-
36
-
37
-
 38
38 -
 39
39 -
 40
40 -
 41
41 -
 42
42 -
 43
43 -
 44
44 -
 45
45 -
 46
46 -
 47
47 -
 48
48 -
 49
49 -
 50
50 -
 51
51 -
 52
52 -
 53
53 -
 54
54 -
 55
55 -
 56
56 -
 57
57 -
 58
58 -
59
-
60
-
61
-
62
-
63
-
64
-
65
-
66
-
67
-
68
-
69
-
70
-
71
-
72
-
73
-
74
-
75
-
76
-
77
-
78
-
79
-
80
-
81
-
82
-
83
-
84
-
85
-
86
-
87
-
88
-
89
-
90
-
91
-
92
-
93
-
94
-
95
-
96
-
97
-
98
-
99
-
100
-
101
-
102
-
103
-
104
-
105
-
106
-
107
-
108
-
109
-
110
-
111
-
112
-
113
-
114
-
115
-
116
-
117
-
118
-
119
-
120
-
121
-
122
-
123
-
124
 |
 |

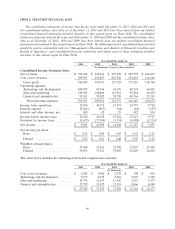
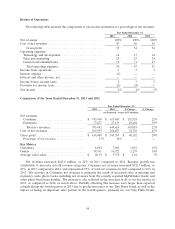
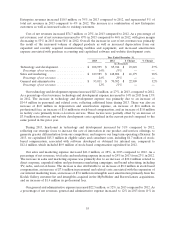
ITEM 6. SELECTED FINANCIAL DATA.
The consolidated statements of income data for the years ended December 31, 2013, 2012 and 2011 and
the consolidated balance sheet data as of December 31, 2013 and 2012 have been derived from our audited
consolidated financial statements included elsewhere in this annual report on Form 10-K. The consolidated
statements of income data for the years ended December 31, 2010 and 2009 and the consolidated balance sheet
data as of December 31, 2011, 2010 and 2009 have been derived from our audited consolidated financial
statements not included in this annual report on Form 10-K. The following selected consolidated financial data
should be read in conjunction with our ‘‘Management’s Discussion and Analysis of Financial Condition and
Results of Operations’’ and consolidated financial statements and related notes to those statements included
elsewhere in this annual report on Form 10-K.
Year Ended December 31,
2013 2012 2011 2010 2009
(In thousands, except per share amounts)
Consolidated Income Statement Data:
Net revenues ................... $ 783,642 $ 640,624 $ 473,270 $ 307,707 $ 246,432
Cost of net revenues ............. 369,593 294,857 219,542 134,491 111,648
Gross profit .................. 414,049 345,767 253,728 173,216 134,784
Operating expenses:
Technology and development ...... 108,995 85,746 65,675 48,393 46,003
Sales and marketing ............ 189,985 148,806 113,952 59,284 44,870
General and administrative ....... 93,011 70,502 58,710 40,764 35,201
Total operating expenses ....... 391,991 305,054 238,337 148,441 126,074
Income from operations ........... 22,058 40,713 15,391 24,775 8,710
Interest expense ................ (9,446) (597) (64) (42) (157)
Interest and other income, net ...... 308 42 35 482 814
Income before income taxes ........ 12,920 40,158 15,362 25,215 9,367
Provision for income taxes ......... (3,635) (17,160) (1,314) (8,088) (3,514)
Net income .................... $ 9,285 $ 22,998 $ 14,048 $ 17,127 $ 5,853
Net income per share:
Basic ....................... $ 0.25 $ 0.64 $ 0.43 $ 0.63 $ 0.23
Diluted ..................... $ 0.24 $ 0.61 $ 0.40 $ 0.59 $ 0.22
Weighted average shares:
Basic ....................... 37,680 35,826 32,788 27,025 25,420
Diluted ..................... 39,493 37,432 35,007 29,249 26,810
The chart above includes the following stock-based compensation amounts:
Year Ended December 31,
2013 2012 2011 2010 2009
(In thousands)
Cost of net revenues ............. $ 2,485 $ 1,696 $ 2,138 $ 508 $ 416
Technology and development ....... 9,477 8,635 8,201 3,069 3,340
Sales and marketing .............. 19,774 11,559 11,350 3,923 3,577
General and administration ........ 21,792 15,432 12,181 8,866 6,940
$ 53,528 $ 37,322 $ 33,870 $ 16,366 $ 14,273
46