Shutterfly 2013 Annual Report Download - page 56
Download and view the complete annual report
Please find page 56 of the 2013 Shutterfly annual report below. You can navigate through the pages in the report by either clicking on the pages listed below, or by using the keyword search tool below to find specific information within the annual report.-
 1
1 -
2
-
3
-
4
-
5
-
6
-
7
-
8
-
9
-
10
-
11
-
12
-
13
-
14
-
15
-
16
-
17
-
18
-
19
-
20
-
21
-
22
-
23
-
24
-
25
-
26
-
27
-
28
-
29
-
30
-
31
-
32
-
33
-
34
-
35
-
36
-
37
-
38
-
39
-
40
-
41
-
42
-
43
-
44
-
45
-
 46
46 -
 47
47 -
 48
48 -
 49
49 -
 50
50 -
 51
51 -
 52
52 -
 53
53 -
 54
54 -
 55
55 -
 56
56 -
 57
57 -
 58
58 -
 59
59 -
 60
60 -
 61
61 -
 62
62 -
 63
63 -
 64
64 -
 65
65 -
 66
66 -
67
-
68
-
69
-
70
-
71
-
72
-
73
-
74
-
75
-
76
-
77
-
78
-
79
-
80
-
81
-
82
-
83
-
84
-
85
-
86
-
87
-
88
-
89
-
90
-
91
-
92
-
93
-
94
-
95
-
96
-
97
-
98
-
99
-
100
-
101
-
102
-
103
-
104
-
105
-
106
-
107
-
108
-
109
-
110
-
111
-
112
-
113
-
114
-
115
-
116
-
117
-
118
-
119
-
120
-
121
-
122
-
123
-
124
 |
 |

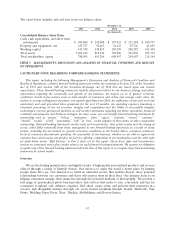
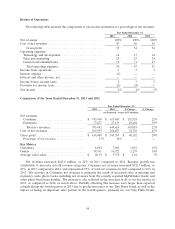
Results of Operations
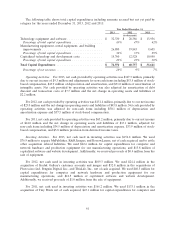
The following table presents the components of our income statement as a percentage of net revenues:
Year Ended December 31,
2013 2012 2011
Net revenues .................................... 100% 100% 100%
Cost of net revenues ............................... 47 46 46
Gross profit .................................. 53 54 54
Operating expenses:
Technology and development ....................... 14 13 14
Sales and marketing ............................. 24 23 24
General and administrative ........................ 12 11 13
Total operating expenses ......................... 50 47 51
Income from operations ............................373
Interest expense .................................. (1) — —
Interest and other income, net ........................———
Income before income taxes .........................273
Provision for income taxes ........................... (1) (3) —
Net income ..................................... 1% 4% 3%
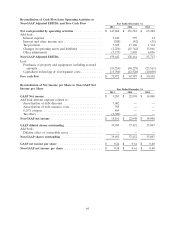
Comparison of the Years Ended December 31, 2013 and 2012
Year Ended December 31,
2013 2012 $ Change % Change
(in thousands, except AOV amounts)
Net revenues
Consumer ........................... $ 745,969 $ 613,445 $ 132,524 22%
Enterprise ........................... 37,673 27,179 10,494 39%
Total net revenues ................... 783,642 640,624 143,018 22%
Cost of net revenues ..................... 369,593 294,857 74,736 25%
Gross profit ........................... $ 414,049 $ 345,767 $ 68,282 20%
Percentage of net revenues ................ 53% 54% ——
Key Metrics
Customers ............................ 8,094 7,062 1,032 15%
Orders ............................... 18,561 16,322 2,239 14%
Average order value ..................... $ 40.19 $ 37.58 $ 2.61 7%
Net revenues increased $143.0 million, or 22%, in 2013 compared to 2012. Revenue growth was
attributable to increases in both revenue categories. Consumer net revenues increased $132.5 million, or
22%, in 2013 compared to 2012, and represented 95% of total net revenues in 2013 compared to 96% in
2012. The increase in Consumer net revenues is primarily the result of increased sales of greeting and
stationery cards, photo books, including net revenues from the recently acquired MyPublisher brand, and
other photo-based merchandise. The increase is also reflected in the increases in all of our key metrics in
2013, as compared to 2012, as noted above. Partially offsetting this increase were larger than expected
refunds during the fourth quarter of 2013 due to production issues at our Tiny Prints brand, as well as the
impact of losing an important sales partner in the fourth quarter, primarily for our Tiny Prints brand.
54