Sharp 2009 Annual Report Download - page 60
Download and view the complete annual report
Please find page 60 of the 2009 Sharp annual report below. You can navigate through the pages in the report by either clicking on the pages listed below, or by using the keyword search tool below to find specific information within the annual report.-
 1
1 -
2
-
3
-
4
-
5
-
6
-
7
-
8
-
9
-
10
-
11
-
12
-
13
-
14
-
15
-
16
-
17
-
18
-
19
-
20
-
21
-
22
-
23
-
24
-
25
-
26
-
27
-
28
-
29
-
30
-
31
-
32
-
33
-
34
-
35
-
36
-
37
-
38
-
39
-
40
-
41
-
42
-
43
-
44
-
45
-
46
-
47
-
48
-
49
-
 50
50 -
 51
51 -
 52
52 -
 53
53 -
 54
54 -
 55
55 -
 56
56 -
 57
57 -
 58
58 -
 59
59 -
 60
60 -
 61
61 -
 62
62 -
 63
63 -
 64
64 -
 65
65 -
 66
66 -
 67
67 -
 68
68
 |
 |

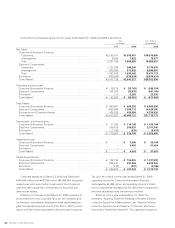
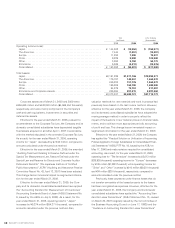
Information by business segment for the years ended March 31, 2008 and 2009 is as follows:
Yen
(millions)
U.S. Dollars
(thousands)
2008 2009 2009
Net Sales:
Consumer/Information Products:
Customers. . . . . . . . . . . . . . . . . . . . . . . . . . . . . . . . . . . . . . . . . . . . . . . . . . ¥2,285,341 ¥1,898,967 $19,576,980
Intersegment. . . . . . . . . . . . . . . . . . . . . . . . . . . . . . . . . . . . . . . . . . . . . . . . 6,365 7,622 78,577
Total . . . . . . . . . . . . . . . . . . . . . . . . . . . . . . . . . . . . . . . . . . . . . . . . . . . . . . . 2,291,706 1,906,589 19,655,557
Electronic Components:
Customers. . . . . . . . . . . . . . . . . . . . . . . . . . . . . . . . . . . . . . . . . . . . . . . . . . 1,132,395 948,260 9,775,876
Intersegment. . . . . . . . . . . . . . . . . . . . . . . . . . . . . . . . . . . . . . . . . . . . . . . . 630,490 571,902 5,895,897
Total . . . . . . . . . . . . . . . . . . . . . . . . . . . . . . . . . . . . . . . . . . . . . . . . . . . . . . . 1,762,885 1,520,162 15,671,773
Elimination . . . . . . . . . . . . . . . . . . . . . . . . . . . . . . . . . . . . . . . . . . . . . . . . . . . (636,855) (579,524) (5,974,474)
Consolidated . . . . . . . . . . . . . . . . . . . . . . . . . . . . . . . . . . . . . . . . . . . . . . . . . . ¥ 3,417,736 ¥2,847,227 $29,352,856
Operating Income (Loss):
Consumer/Information Products. . . . . . . . . . . . . . . . . . . . . . . . . . . . . . . . . . . ¥ 79,218 ¥ (33,769) $ (348,134)
Electronic Components. . . . . . . . . . . . . . . . . . . . . . . . . . . . . . . . . . . . . . . . . . 104,363 (23,975) (247,165)
Elimination . . . . . . . . . . . . . . . . . . . . . . . . . . . . . . . . . . . . . . . . . . . . . . . . . . . 111 2,263 23,330
Consolidated . . . . . . . . . . . . . . . . . . . . . . . . . . . . . . . . . . . . . . . . . . . . . . . . . . ¥ 183,692 ¥ (55,481) $ (571,969)
Total Assets:
Consumer/Information Products. . . . . . . . . . . . . . . . . . . . . . . . . . . . . . . . . . . ¥ 950,857 ¥ 869,392 $ 8,962,804
Electronic Components. . . . . . . . . . . . . . . . . . . . . . . . . . . . . . . . . . . . . . . . . . 1,686,595 1,398,773 14,420,340
Elimination and Corporate Assets. . . . . . . . . . . . . . . . . . . . . . . . . . . . . . . . . . 435,755 420,556 4,335,629
Consolidated . . . . . . . . . . . . . . . . . . . . . . . . . . . . . . . . . . . . . . . . . . . . . . . . . . ¥3,073,207 ¥2,688,721 $27,718,773
Depreciation and Amortization:
Consumer/Information Products. . . . . . . . . . . . . . . . . . . . . . . . . . . . . . . . . . . ¥ 71,298 ¥ 115,798 $ 1,193,794
Electronic Components. . . . . . . . . . . . . . . . . . . . . . . . . . . . . . . . . . . . . . . . . . 206,429 200,920 2,071,340
Elimination . . . . . . . . . . . . . . . . . . . . . . . . . . . . . . . . . . . . . . . . . . . . . . . . . . . (1,160) (919) (9,474)
Consolidated . . . . . . . . . . . . . . . . . . . . . . . . . . . . . . . . . . . . . . . . . . . . . . . . . . ¥ 276,567 ¥ 315,799 $ 3,255,660
Impairment Loss:
Consumer/Information Products. . . . . . . . . . . . . . . . . . . . . . . . . . . . . . . . . . . ¥ – ¥ 3,506 $ 36,144
Electronic Components. . . . . . . . . . . . . . . . . . . . . . . . . . . . . . . . . . . . . . . . . . – 5,962 61,464
Elimination . . . . . . . . . . . . . . . . . . . . . . . . . . . . . . . . . . . . . . . . . . . . . . . . . . . – – –
Consolidated . . . . . . . . . . . . . . . . . . . . . . . . . . . . . . . . . . . . . . . . . . . . . . . . . . ¥ – ¥ 9,468 $ 97,608
Capital Expenditures:
Consumer/Information Products. . . . . . . . . . . . . . . . . . . . . . . . . . . . . . . . . . . ¥ 128,194 ¥ 106,855 $ 1,101,598
Electronic Components. . . . . . . . . . . . . . . . . . . . . . . . . . . . . . . . . . . . . . . . . . 308,441 221,386 2,282,330
Elimination . . . . . . . . . . . . . . . . . . . . . . . . . . . . . . . . . . . . . . . . . . . . . . . . . . . (410) (407) (4,196)
Consolidated . . . . . . . . . . . . . . . . . . . . . . . . . . . . . . . . . . . . . . . . . . . . . . . . . . ¥ 436,225 ¥ 327,834 $ 3,379,732
Corporate assets as of March 31, 2008 and 2009 were
¥464,645 million and ¥442,849 million ($4,565,454 thousand),
respectively, and were mainly comprised of the Company’s
cash and cash equivalents, investments in securities and
deferred tax assets.
Effective for the year ended March 31, 2008, pursuant to
an amendment to the Corporate Tax Law, the Company and
its domestic consolidated subsidiaries have depreciated tan-
gible fixed assets acquired on and after April 1, 2007 in accor-
dance with the method stipulated in the amended Corporate
Tax Law. As a result, for the year ended March 31, 2008,
operating income for Consumer/Information Products
decreased by ¥3,096 million and operating income for Elec-
tronic Components decreased by ¥4,138 million, compared to
amounts calculated under the previous method.
Effective for the year ended March 31, 2008, the
amended “Auditing Treatment Relating to Reserve Defined
under the Special Tax Measurement Law, Reserve Defined
under the Special Law and Reserve for Director and Corpo-
rate Auditor Retirement Benefits” (The Japanese Institute of