Sharp 2009 Annual Report Download - page 41
Download and view the complete annual report
Please find page 41 of the 2009 Sharp annual report below. You can navigate through the pages in the report by either clicking on the pages listed below, or by using the keyword search tool below to find specific information within the annual report.-
 1
1 -
2
-
3
-
4
-
5
-
6
-
7
-
8
-
9
-
10
-
11
-
12
-
13
-
14
-
15
-
16
-
17
-
18
-
19
-
20
-
21
-
22
-
23
-
24
-
25
-
26
-
27
-
28
-
29
-
30
-
 31
31 -
 32
32 -
 33
33 -
 34
34 -
 35
35 -
 36
36 -
 37
37 -
 38
38 -
 39
39 -
 40
40 -
 41
41 -
 42
42 -
 43
43 -
 44
44 -
 45
45 -
 46
46 -
 47
47 -
 48
48 -
 49
49 -
 50
50 -
 51
51 -
52
-
53
-
54
-
55
-
56
-
57
-
58
-
59
-
60
-
61
-
62
-
63
-
64
-
65
-
66
-
67
-
68
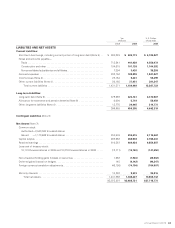
 |
 |
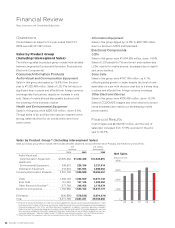
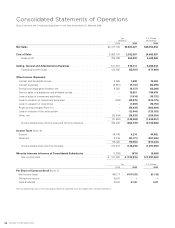
Selling, general and administrative (SG&A) expenses
were ¥510,311 million, and the ratio of SG&A expenses
against net sales increased from 16.7% to 17.9%. SG&A
expenses included advertising expenses of ¥67,259
million and employees’ salaries and other benefits of
¥115,917 million.
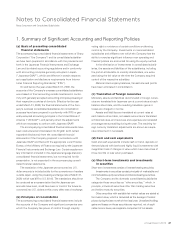
As a result, operating loss amounted to ¥55,481 million
(operating income of ¥183,692 million in the prior year).
Other expenses, net of other income was an other
net loss of ¥148,658 million.
Loss before income taxes and minority interests
amounted to ¥204,139 million (income before income
taxes and minority interests of ¥162,240 million in the
prior year). Net loss for the year was ¥125,815 million (net
income of ¥101,922 million in the prior year). Net loss per
share of common stock was ¥114.33.
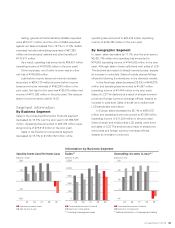
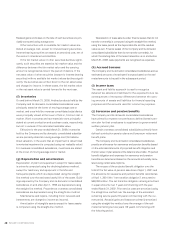
Sales in the Consumer/Information Products segment
decreased by 16.8% over the prior year to ¥1,906,589
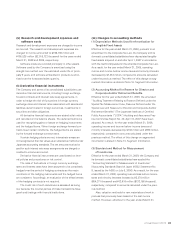
million. Operating loss amounted to ¥33,769 million (oper-
ating income of ¥79,218 million in the prior year).
Sales in the Electronic Components segment
decreased by 13.8% to ¥1,520,162 million, while
operating loss amounted to ¥23,975 million (operating
income of ¥104,363 million in the prior year).
In Japan, sales decreased by 17.7% over the prior year to
¥2,421,705 million and operating loss amounted to
¥74,552 (operating income of ¥144,502 million in the prior
year). Although sales of solar cells fared well, sales of LCD
TVs declined as a result of sharply lowered prices, despite
an increase in units sold. Sales of mobile phones fell sig-
nificantly following the slowdown in the domestic market.
In the Americas, sales decreased 22.8% to ¥446,275
million and operating loss amounted to ¥1,057 million
(operating income of ¥7,444 million in the prior year).
Sales of LCD TVs declined as a result of sharply lowered
prices and foreign currency exchange effects, despite an
increase in units sold. Sales of small- and medium-size
LCD panels also went down.
In Europe, sales decreased by 22.1% to ¥430,572
million and operating income amounted to ¥7,395 million
(operating income of ¥11,280 million in the prior year).
Sales of small- and medium-size LCD panels were down
and sales of LCD TVs declined as a result of sharply low-
ered prices and foreign currency exchange effects,
despite an increase in units sold.
Operating Income (Loss)/Net Income (Loss)
(billions of yen)
Sales*1
(billions of yen)
Operating Income (Loss)*2
(billions of yen)
200
100
0
–100
07
–200
08 090605
2,500
2,000
1,500
1,000
500
07
0
08 090605
120
80
40
0
07
–40
08 090605
nn Operating Income (Loss)
nn Net Income (Loss)
nn Consumer/Information Products
nn Electronic Components
nn Consumer/Information Products
nn Electronic Components
*1 Including intersegment sales *2 Before elimination of intersegment trading
Information by Business Segment