Sharp 2009 Annual Report Download - page 42
Download and view the complete annual report
Please find page 42 of the 2009 Sharp annual report below. You can navigate through the pages in the report by either clicking on the pages listed below, or by using the keyword search tool below to find specific information within the annual report.-
 1
1 -
2
-
3
-
4
-
5
-
6
-
7
-
8
-
9
-
10
-
11
-
12
-
13
-
14
-
15
-
16
-
17
-
18
-
19
-
20
-
21
-
22
-
23
-
24
-
25
-
26
-
27
-
28
-
29
-
30
-
31
-
 32
32 -
 33
33 -
 34
34 -
 35
35 -
 36
36 -
 37
37 -
 38
38 -
 39
39 -
 40
40 -
 41
41 -
 42
42 -
 43
43 -
 44
44 -
 45
45 -
 46
46 -
 47
47 -
 48
48 -
 49
49 -
 50
50 -
 51
51 -
 52
52 -
53
-
54
-
55
-
56
-
57
-
58
-
59
-
60
-
61
-
62
-
63
-
64
-
65
-
66
-
67
-
68
 |
 |
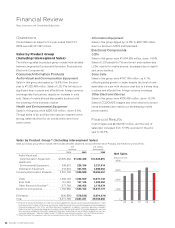
In China, sales increased by 0.2% to ¥642,716 million
and operating income amounted to ¥9,988 million (operat-
ing income of ¥9,835 million in the prior year). Sales of
CCD/CMOS imagers fell, while sales of LCD TVs were
strong and sales of mobile phones expanded.
In Other, sales were down 17.0% to ¥315,730 million
and operating income amounted to ¥5,158 million (operat-
ing income of ¥3,683 million in the prior year). Sales of
solar cells expanded, however, sales of LCD panels for
TVs and microwave ovens decreased.
*
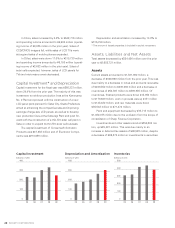
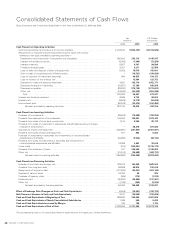
Capital investment for the fiscal year was ¥260,337 million,
down 24.4% from the prior year. The majority of this was
investment to reinforce production lines at the Kameyama
No. 2 Plant and proceed with the construction of a new
LCD panel plant planned for Sakai City, Osaka Prefecture
aimed at enhancing the competitiveness and improving
earnings of large-size LCD panels, as well as to develop
new production lines at the Katsuragi Plant and push for-
ward with the construction of a thin-film solar cell plant in
Sakai in order to expand its thin-film solar cell business.
The capital investment of Consumer/Information
Products was ¥47,238 million and of Electronic Compo-
nents was ¥213,099 million.
Depreciation and amortization increased by 14.2% to
¥315,799 million.
* The amount of leased properties is included in capital investment.
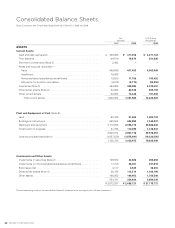
Total assets decreased by ¥384,486 million over the prior
year to ¥2,688,721 million.
Current assets amounted to ¥1,301,962 million, a
decrease of ¥340,660 million from the prior year. This was
due mainly to a decrease in notes and accounts receivable
of ¥249,852 million to ¥430,064 million and a decrease in
inventories of ¥54,367 million to ¥399,985 million. Of
inventories, finished products were down ¥18,950 million
to ¥179,629 million, work in process was up ¥131 million
to ¥148,482 million, and raw materials were down
¥35,548 million to ¥71,874 million.
Plant and equipment decreased by ¥73,713 million to
¥1,032,075 million due to the exclusion from the scope of
consolidation of Sharp Finance Corporation.
Investments and other assets stood at ¥354,684 mil-
lion, up ¥29,887 million. This was due mainly to an
increase in deferred tax assets of ¥86,520 million, despite
a decrease of ¥65,278 million in investments in securities.
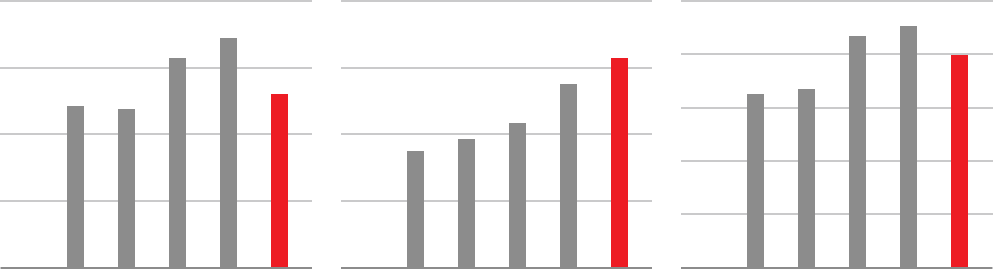
Inventories
(billions of yen)
Depreciation and Amortization
(billions of yen)
Capital Investment
(billions of yen)
500
400
300
200
100
07
0
08 090605
07 08 090605
400
300
200
100
0
400
300
200
100
07
0
08 090605