Sharp 2009 Annual Report Download - page 45
Download and view the complete annual report
Please find page 45 of the 2009 Sharp annual report below. You can navigate through the pages in the report by either clicking on the pages listed below, or by using the keyword search tool below to find specific information within the annual report.-
 1
1 -
2
-
3
-
4
-
5
-
6
-
7
-
8
-
9
-
10
-
11
-
12
-
13
-
14
-
15
-
16
-
17
-
18
-
19
-
20
-
21
-
22
-
23
-
24
-
25
-
26
-
27
-
28
-
29
-
30
-
31
-
32
-
33
-
34
-
 35
35 -
 36
36 -
 37
37 -
 38
38 -
 39
39 -
 40
40 -
 41
41 -
 42
42 -
 43
43 -
 44
44 -
 45
45 -
 46
46 -
 47
47 -
 48
48 -
 49
49 -
 50
50 -
 51
51 -
 52
52 -
 53
53 -
 54
54 -
 55
55 -
56
-
57
-
58
-
59
-
60
-
61
-
62
-
63
-
64
-
65
-
66
-
67
-
68
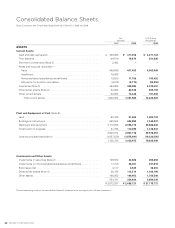
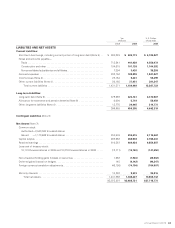
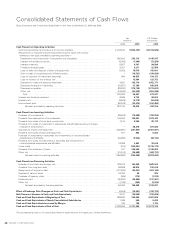
 |
 |

Yen
(millions)
U.S. Dollars
(thousands)
2008 2009 2009
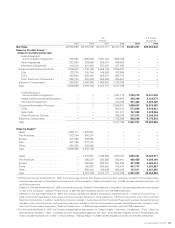
LIABILITIES AND NET ASSETS
Current Liabilities:
Short-term borrowings, including current portion of long-term debt (Note 5) . . ¥ 324,328 ¥ 405,773 $ 4,183,227
Notes and accounts payable—
Trade . . . . . . . . . . . . . . . . . . . . . . . . . . . . . . . . . . . . . . . . . . . . . . . . . . . . . . . . 713,541 441,939 4,556,072
Construction and other . . . . . . . . . . . . . . . . . . . . . . . . . . . . . . . . . . . . . . . . . . 104,615 107,126 1,104,392
Nonconsolidated subsidiaries and affiliates. . . . . . . . . . . . . . . . . . . . . . . . . . . 7,354 3,420 35,258
Accrued expenses . . . . . . . . . . . . . . . . . . . . . . . . . . . . . . . . . . . . . . . . . . . . . . . 232,194 188,299 1,941,227
Income taxes (Note 4). . . . . . . . . . . . . . . . . . . . . . . . . . . . . . . . . . . . . . . . . . . . . 23,154 5,461 56,299
Other current liabilities (Note 4) . . . . . . . . . . . . . . . . . . . . . . . . . . . . . . . . . . . . . 26,185 37,951 391,247
Total current liabilities . . . . . . . . . . . . . . . . . . . . . . . . . . . . . . . . . . . . . . . . . 1,431,371 1,189,969 12,267,722
Long-term Liabilities:
Long-term debt (Note 5) . . . . . . . . . . . . . . . . . . . . . . . . . . . . . . . . . . . . . . . . . . . 379,593 424,141 4,372,587
Allowance for severance and pension benefits (Note 9) . . . . . . . . . . . . . . . . . . 6,600 5,719 58,959
Other long-term liabilities (Note 4) . . . . . . . . . . . . . . . . . . . . . . . . . . . . . . . . . . . 13,775 20,445 210,773
399,968 450,305 4,642,319
Contingent Liabilities (Note 8)
Net Assets (Note 7):
Common stock:
Authorized—2,500,000 thousand shares
Issued —1,110,699 thousand shares . . . . . . . . . . . . . . . . . . . . . . . . . . . . 204,676 204,676 2,110,062
Capital surplus. . . . . . . . . . . . . . . . . . . . . . . . . . . . . . . . . . . . . . . . . . . . . . . . . . . 268,582 268,538 2,768,433
Retained earnings . . . . . . . . . . . . . . . . . . . . . . . . . . . . . . . . . . . . . . . . . . . . . . . . 816,387 664,924 6,854,887
Less cost of treasury stock:
10,174 thousand shares in 2008 and 10,219 thousand shares in 2009 . . . . . (13,711) (13,740) (141,650)
Net unrealized holding gains (losses) on securities . . . . . . . . . . . . . . . . . . . . . . 1,662 (1,946) (20,062)
Deferred gains (losses) on hedges . . . . . . . . . . . . . . . . . . . . . . . . . . . . . . . . . . . 145 (9,142) (94,247)
Foreign currency translation adjustments. . . . . . . . . . . . . . . . . . . . . . . . . . . . . . (46,155) (74,196) (764,907)
Minority interests . . . . . . . . . . . . . . . . . . . . . . . . . . . . . . . . . . . . . . . . . . . . . . . . 10,282 9,333 96,216
Total net assets . . . . . . . . . . . . . . . . . . . . . . . . . . . . . . . . . . . . . . . . . . . . . . 1,241,868 1,048,447 10,808,732
¥3,073,207 ¥2,688,721 $27,718,773