Sharp 2009 Annual Report Download - page 52
Download and view the complete annual report
Please find page 52 of the 2009 Sharp annual report below. You can navigate through the pages in the report by either clicking on the pages listed below, or by using the keyword search tool below to find specific information within the annual report.-
 1
1 -
2
-
3
-
4
-
5
-
6
-
7
-
8
-
9
-
10
-
11
-
12
-
13
-
14
-
15
-
16
-
17
-
18
-
19
-
20
-
21
-
22
-
23
-
24
-
25
-
26
-
27
-
28
-
29
-
30
-
31
-
32
-
33
-
34
-
35
-
36
-
37
-
38
-
39
-
40
-
41
-
 42
42 -
 43
43 -
 44
44 -
 45
45 -
 46
46 -
 47
47 -
 48
48 -
 49
49 -
 50
50 -
 51
51 -
 52
52 -
 53
53 -
 54
54 -
 55
55 -
 56
56 -
 57
57 -
 58
58 -
 59
59 -
 60
60 -
 61
61 -
 62
62 -
63
-
64
-
65
-
66
-
67
-
68
 |
 |

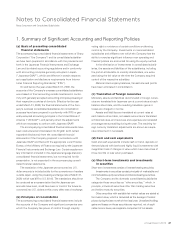
2009, the Company and its domestic consolidated subsidiar-
ies have adopted the moving average method in order to
properly reflect the impact of fluctuations in raw material
prices on financial statements, and to achieve more appropri-
ate periodic accounting of profit and loss. This change has an
immaterial impact on the financial statements for the year
ended March 31, 2009.
The effect of these changes on segmented information is
stated in Note 10. Segment Information.
(4) Practical Solution on Unification of Accounting
Policies Applied to Foreign Subsidiaries for Con-
solidated Financial Statements
Effective for the year ended March 31, 2009, the Company has
applied the “Practical Solution on Unification of Accounting Poli-
cies Applied to Foreign Subsidiaries for Consolidated Financial
Statements” (ASBJ PITF No. 18, issued by the ASBJ on May 17,
2006) and made revisions required for consolidated accounting.
As a result, for the year ended March 31, 2009, operating loss
and loss before income taxes and minority interests increase by
¥1,804 million ($18,598 thousand) and ¥1,922 million ($19,814
thousand), respectively, compared to amounts calculated under
the previous method. The effect of this change on segmented
information is stated in Note 10. Segment Information.
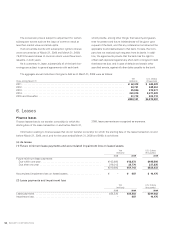
(5) Accounting Standard for Lease Transactions
Previously, lease payments under finance leases that do not
transfer ownership of the leased property to the lessee had
been recognized as expenses. However, effective for the
year ended March 31, 2009, the Company and its domestic
consolidated subsidiaries have applied the “Accounting Stan-
dard for Lease Transactions” (ASBJ Statement No. 13, revised
on March 30, 2007 (originally issued by the 1st committee of
the Business Accounting Council on June 17, 1993)) and the
“Guidance on Accounting Standard for Lease Transactions”
(ASBJ Guidance No. 16, revised on March 30, 2007 (originally
issued by the Auditing Standards Committee of JICPA on
January 18, 1994)) and are accounting for such transactions as
capital lease transactions. Finance leases that do not transfer
ownership for which the starting date of the lease transaction
is on and before March 31, 2008, lease payments are recog-
nized as expenses. This change has an immaterial impact on
the financial statements for the year ended March 31, 2009.
The effect of this change on segmented information is stated
in Note 10. Segment Information.
Previously, the Company had depreciated tangible fixed assets
acquired on and before March 31, 2007 up to 5% of the acquisi-
tion cost, based on the prior Corporate Tax Law. Pursuant to an
amendment to the Corporate Tax Law, the Company and its
domestic subsidiaries have depreciated the difference between
5% of the acquisition cost and the memorandum price (¥1) using
the straight line method over 5 years. The straight line deprecia-
tion starts from the following year, when the book value of tan-
gible assets acquired on and before March 31, 2007 reaches 5%
of the acquisition cost. As a result, for the year ended March 31,
2008, operating income and income before income taxes and
minority interests decreased by ¥7,791 million, compared to
amounts calculated under the previous method.
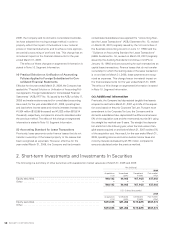
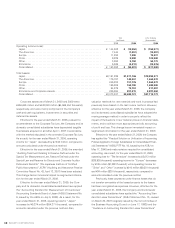
2. Short-term Investments and Investments In Securities
The following is a summary of other securities with available fair market values as of March 31, 2008 and 2009:
Yen (millions)
2009
Acquisition
cost
Unrealized
gains
Unrealized
losses
Fair market
value
Equity securities . . . . . . . . . . . . . . . . . . . . . . . . . . . . . . . . . . . . . . . . . . . . . . . . ¥40,142 ¥4,003 ¥(7,142) ¥37,003
Other . . . . . . . . . . . . . . . . . . . . . . . . . . . . . . . . . . . . . . . . . . . . . . . . . . . . . . . . – – – –
¥40,142 ¥4,003 ¥(7,142) ¥37,003
U.S. Dollars (thousands)
2009
Acquisition
cost
Unrealized
gains
Unrealized
losses
Fair market
value
Equity securities . . . . . . . . . . . . . . . . . . . . . . . . . . . . . . . . . . . . . . . . . . . . . . . . $413,835 $41,268 $(73,629) $381,474
Other . . . . . . . . . . . . . . . . . . . . . . . . . . . . . . . . . . . . . . . . . . . . . . . . . . . . . . . . – – – –
$413,835 $41,268 $(73,629) $381,474