Royal Caribbean Cruise Lines 2008 Annual Report Download - page 40
Download and view the complete annual report
Please find page 40 of the 2008 Royal Caribbean Cruise Lines annual report below. You can navigate through the pages in the report by either clicking on the pages listed below, or by using the keyword search tool below to find specific information within the annual report.-
 1
1 -
2
-
3
-
4
-
5
-
6
-
7
-
8
-
9
-
10
-
11
-
12
-
13
-
14
-
15
-
16
-
17
-
18
-
19
-
20
-
21
-
22
-
23
-
24
-
25
-
26
-
27
-
28
-
29
-
 30
30 -
 31
31 -
 32
32 -
 33
33 -
 34
34 -
 35
35 -
 36
36 -
 37
37 -
 38
38 -
 39
39 -
 40
40 -
 41
41 -
 42
42 -
 43
43 -
 44
44 -
 45
45 -
 46
46 -
 47
47 -
 48
48 -
 49
49 -
 50
50 -
51
-
52
-
53
-
54
-
55
-
56
-
57
-
58
-
59
-
60
-
61
-
62
-
63
-
64
-
65
-
66
-
67
-
68
-
69
-
70
-
71
-
72
-
73
-
74
-
75
-
76
 |
 |

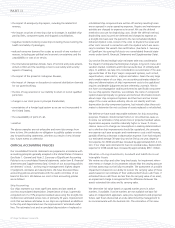
24 Royal Caribbean Cruises Ltd.
Our cruise operating expenses consist of the following:
s Commissions, transportation and other expenses consist of those
costs directly associated with passenger ticket revenues, including
travel agent commissions, air and other transportation expenses,
port costs that vary with passenger head counts and related credit
card fees.
s Onboard and other expenses consist of the direct costs associated
with onboard and other revenues. These costs include the cost of
products sold onboard our ships, vacation protection insurance pre-
miums, costs associated with pre- and post-cruise tours and related
credit card fees. These costs also include minimal costs associated
with concession revenues, as the costs are mostly incurred by third-
party concessionaires.
s Payroll and related expenses consist of costs for shipboard personnel.
s Food expenses include food costs for both passengers and crew.
s Fuel expenses include fuel and related delivery and storage costs,
including the financial impact of fuel swap agreements.
Other operating expenses consist primarily of operating costs such as
repairs and maintenance, port costs that do not vary with passenger
head counts, vessel operating lease costs, costs associated with Pull-
mantur’s land-based tours, vessel related insurance and entertainment.
We do not allocate payroll and related costs, food costs, fuel costs or
other operating costs to the expense categories attributable to pas-
senger ticket revenues or onboard and other revenues since they are
incurred to provide the total cruise vacation experience.
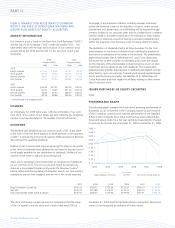
NON-GAAP FINANCIAL MEASURES
Available Passenger Cruise Days (“APCD”) are our measurement of
capacity and represent double occupancy per cabin multiplied by the
number of cruise days for the period. We use this measure to perform
capacity and rate analysis to identify our main non-capacity drivers
which cause our cruise revenue and expenses to vary.
Gross Cruise Costs represent the sum of total cruise operating expenses
plus marketing, selling and administrative expenses.
Gross Yields represent total revenues per APCD.
Net Cruise Costs represent Gross Cruise Costs excluding commissions,
transportation and other expenses and onboard and other expenses
(each of which is described above under the Terminology heading).
In measuring our ability to control costs in a manner that positively
impacts net income, we believe changes in Net Cruise Costs to be
the most relevant indicator of our performance. A reconciliation of
historical Gross Cruise Costs to Net Cruise Costs is provided below
under Summary of Historical Results of Operations. We have not pro-
vided a quantitative reconciliation of projected Gross Cruise Costs
to projected Net Cruise Costs due to the significant uncertainty in
projecting the costs deducted to arrive at this measure. Accordingly,
we do not believe that reconciling information for such projected
figures would be meaningful.
Net Debt-to-Capital is a ratio which represents total long-term debt,
including current portion of long-term debt, less cash and cash equiva-
lents (“Net Debt”) divided by the sum of Net Debt and total shareholders’
equity. We believe Net Debt and Net Debt-to-Capital, along with total
long-term debt and shareholders’ equity are useful measures of our
capital structure. A reconciliation of historical Debt-to-Capital to Net
Debt-to-Capital is provided below under Summary of Historical Results
of Operations.
Net Revenues represent total revenues less commissions, transportation
and other expenses and onboard and other expenses (each of which is
described under the Terminology heading).
Net Yields represent Net Revenues per APCD. We utilize Net Revenues
and Net Yields to manage our business on a day-to-day basis as we
believe that it is the most relevant measure of our pricing performance
because it reflects the cruise revenues earned by us net of our most
significant variable costs, which are commissions, transportation and
other expenses and onboard and other expenses. A reconciliation of
historical Gross Yields to Net Yields is provided below under Summary
of Historical Results of Operations. We have not provided a quantitative
reconciliation of projected Gross Yields to projected Net Yields due to
the significant uncertainty in projecting the costs deducted to arrive at
this measure. Accordingly, we do not believe that reconciling informa-
tion for such projected figures would be meaningful.
Occupancy, in accordance with cruise vacation industry practice, is calcu-
lated by dividing Passenger Cruise Days by APCD. A percentage in excess
of 100% indicates that three or more passengers occupied some cabins.
Passenger Cruise Days represent the number of passengers carried for
the period multiplied by the number of days of their respective cruises.
The use of certain significant non-GAAP measures, such as Net Yields
and Net Cruise Costs, allow us to perform capacity and rate analysis to
separate the impact of known capacity changes from other less predict-
able changes which affect our business. We believe these non-GAAP
measures provide expanded insight to measure revenue and cost per-
formance in addition to the standard United States GAAP based finan-
cial measures. There are no specific rules or regulations for determining
non-GAAP measures, and as such, there exists the possibility that they
may not be comparable to other companies within the industry.
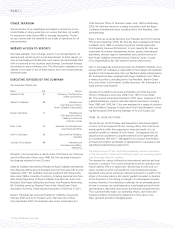
EXECUTIVE OVERVIEW
We have seen a dramatic change in our operating environment during
the past several months. The current worldwide economic downturn
and the meltdown of the global credit and capital markets have resulted
in significant deterioration in consumer confidence and spending. In
addition, the current disruption and tightening of the credit and capital
markets may make it more difficult for us to secure financing or to raise
additional capital or to do so on acceptable terms. We are starting to
experience significant compression in our booking window and for-
ward bookings are lagging behind levels achieved during the last
few years as consumers are delaying their purchase decisions. The
extent and duration of this worldwide economic downturn is uncer-
tain. Forecasting demand in 2009 is extremely difficult and we expect
this difficult environment to continue at least through 2009. As a
result, we expect 2009 Net Yields to decrease in the range of 9%
to 13% compared to 2008.
PART II