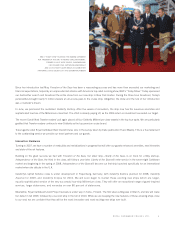
Royal Caribbean Cruise Lines 2006 Annual Report Download - page 13
Download and view the complete annual report
Please find page 13 of the 2006 Royal Caribbean Cruise Lines annual report below. You can navigate through the pages in the report by either clicking on the pages listed below, or by using the keyword search tool below to find specific information within the annual report.-
 1
1 -
2
-
 3
3 -
 4
4 -
 5
5 -
 6
6 -
 7
7 -
 8
8 -
 9
9 -
 10
10 -
 11
11 -
 12
12 -
 13
13 -
 14
14 -
 15
15 -
 16
16 -
 17
17 -
 18
18 -
 19
19 -
 20
20 -
 21
21 -
 22
22 -
 23
23 -
24
-
25
-
26
-
27
-
28
-
29
-
30
-
31
-
32
-
33
-
34
-
35
-
36
-
37
-
38
-
39
-
40
-
41
-
42
-
43
-
44
 |
 |

would have increased by approximately $27.4 million. If our ships
were estimated to have no residual value, depreciation expense for
2006 would have increased by approximately $93.9 million.
Valuation of Long-Lived Assets and Goodwill
We review long-lived assets for impairment whenever events or
changes in circumstances indicate that the carrying amount of these
assets may not be fully recoverable. The assessment of possible
impairment is based on our ability to recover the carrying value of
our asset based on our estimate of its undiscounted future cash
flows. If these estimated future cash flows were less than the carry-
ing value of the asset, an impairment charge would be recognized
for the difference between the asset’s estimated fair value and its
carrying value.
The determination of fair value is based on quoted market prices in
active markets, if available. Such markets are often not available for
used cruise ships. Accordingly, we also base fair value on independ-
ent appraisals, sales price negotiations and projected future cash
flows discounted at a rate determined by management to be com-
mensurate with our business risk. The estimation of fair value utiliz-
ing discounted forecasted cash flows includes numerous
uncertainties which require our significant judgment when making
assumptions of revenues, operating costs, marketing, selling and
administrative expenses, interest rates, ship additions and retire-
ments, cruise vacation industry competition and general economic
and business conditions, among other factors.
Goodwill and other intangible assets are reviewed annually or when-
ever events or changes in circumstances indicate that the carrying
amount of the intangible asset may not be fully recoverable. The
impairment review consists of comparing the fair value of our report-
ing units with their carrying value including the intangible asset. If
the carrying value of the reporting unit exceeds its fair value, it may
be an indication of possible impairment of assets. In this case we
would compare the fair value of the reporting unit to the carrying
value of the intangible asset. If the carrying value of the intangible
asset exceeds the fair value of the reporting unit, an impairment
charge would be recognized for the difference between the carrying
value of the intangible asset and the fair value of the reporting unit.
We use a present value of future cash flows approach to determine
the fair value of our reporting units.
We believe we have made reasonable estimates and judgments in
determining whether our long-lived assets and intangible assets have
been impaired; however, if there is a material change in the assump-
tions used in our determination of fair values or if there is a materi-
al change in the conditions or circumstances influencing fair value,
we could be required to recognize a material impairment charge.
Contingencies – Litigation
On an ongoing basis, we assess the potential liabilities related to any
lawsuits or claims brought against us. While it is typically very difficult
to determine the timing and ultimate outcome of such actions, we
use our best judgment to determine if it is probable that we will incur
an expense related to the settlement or final adjudication of such
matters and whether a reasonable estimation of such probable loss,
if any, can be made. In assessing probable losses, we take into con-
sideration estimates of the amount of insurance recoveries, if any.
We accrue a liability when we believe a loss is probable and the
amount of loss can be reasonably estimated. Due to the inherent
uncertainties related to the eventual outcome of litigation and poten-
tial insurance recoveries, it is possible that certain matters may be
resolved for amounts materially different from any provisions or dis-
closures that we have previously made.
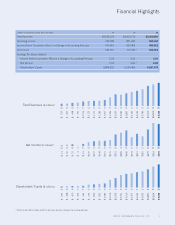
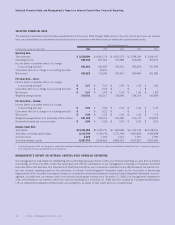
TERMINOLOGY AND NON-GAAP FINANCIAL MEASURES
Available Passenger Cruise Days (“APCD”) are our measurement of
capacity and represent double occupancy per cabin multiplied by
the number of cruise days for the period.
Gross Cruise Costs represent the sum of total cruise operating
expenses plus marketing, selling and administrative expenses.
Gross Yields represent total revenues per APCD.
Net Cruise Costs represent Gross Cruise Costs excluding commis-
sions, transportation and other expenses and onboard and other
expenses (each of which is described below under the Overview
heading). In measuring our ability to control costs in a manner that
positively impacts net income, we believe changes in Net Cruise
Costs to be the most relevant indicator of our performance. A recon-
ciliation of historical Gross Cruise Costs to Net Cruise Costs is pro-
vided below under
Summary of Historical Results of Operations
. We
have not provided a quantitative reconciliation of projected Gross
Cruise Costs to projected Net Cruise Costs due to the significant
uncertainty in projecting the costs deducted to arrive at this meas-
ure. Accordingly, we do not believe that reconciling information for
such projected figures would be meaningful.
Net Debt-to-Capital is a ratio which represents total long-term debt,
including current portion of long-term debt, less cash and cash
equivalents (“Net Debt”) divided by the sum of Net Debt and share-
holders' equity (“Capital”). We believe Net Debt and Net Debt-to-
Capital, along with total long-term debt and shareholders’ equity are
useful measures of our capital structure. A reconciliation of histori-
cal Debt-to-Capital to Net Debt-to-Capital is provided below under
Summary of Historical Results of Operations
.
Net Yields represent Gross Yields less commissions, transportation
and other expenses and onboard and other expenses (each of which
is described below under the Overview heading) per APCD. We uti-
lize Net Yields to manage our business on a day-to-day basis and
believe that it is the most relevant measure of our pricing perform-
ance because it reflects the cruise revenues earned by us net of our
most significant variable costs. A reconciliation of historical Gross
Yields to Net Yields is provided below under
Summary of Historical
Results of Operations
. We have not provided a quantitative reconcil-
iation of projected Gross Yields to projected Net Yields due to the
significant uncertainty in projecting the costs deducted to arrive at
this measure. Accordingly, we do not believe that reconciling infor-
mation for such projected figures would be meaningful.
Occupancy, in accordance with cruise vacation industry practice, is
calculated by dividing Passenger Cruise Days by APCD. A percent-
age in excess of 100% indicates that three or more passengers
occupied some cabins.
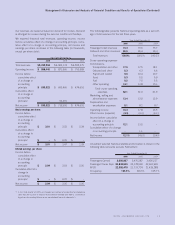
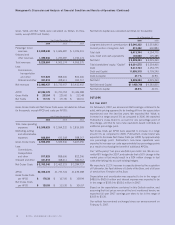
ROYAL CARIBBEAN CRUISES LTD. 11
Management’s Discussion and Analysis of Financial Condition and Results of Operations (Continued)