Ricoh 2011 Annual Report Download - page 9
Download and view the complete annual report
Please find page 9 of the 2011 Ricoh annual report below. You can navigate through the pages in the report by either clicking on the pages listed below, or by using the keyword search tool below to find specific information within the annual report.-
 1
1 -
 2
2 -
 3
3 -
 4
4 -
 5
5 -
 6
6 -
 7
7 -
 8
8 -
 9
9 -
 10
10 -
 11
11 -
 12
12 -
 13
13 -
 14
14 -
 15
15 -
 16
16 -
 17
17 -
 18
18 -
 19
19 -
 20
20 -
21
-
22
-
23
-
24
-
25
-
26
-
27
-
28
-
29
-
30
-
31
-
32
-
33
-
34
-
35
-
36
-
37
-
38
 |
 |

ANNUAL REPORT 2011 8
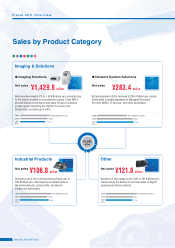
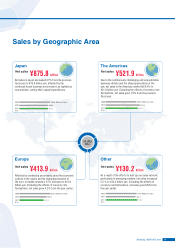
Sales by Geographic Area
Europe Other
Japan The Americas
Net sales
Net sales
Net sales
Net sales
Affected by continuing uncertainty about the economic
outlook in the region and the sharp depreciation of
the euro, net sales showed a 9.7% decrease to 413.9
billion yen. Excluding the effects of currency rate
fluctuations, net sales grew 4.2% from the year earlier.
As a result of the efforts to beef up our sales network,
particularly in emerging markets, net sales increased
5.5 % to 130.2 billion yen. Excluding the effects of
currency rate fluctuations, net sales grew 9.8% from
the year earlier.
Net sales in Japan decreased 0.1% from the previous
fiscal year to 875.8 billion yen, affected by the
continued harsh business environment, as typified as
corporations’ cutting their capital expenditures.
Due to the continuously challenging and unpredictable
business climate and the sharp appreciation of the
yen, net sales in the Americas market fell 6.4% to
521.9 billion yen. Excluding the effects of currency rate
fluctuations, net sales grew 1.5% from the previous
fiscal year.
¥1,942
billion
¥875.8 billion
¥413.9 billion
¥521.9 billion
¥130.2 billion
2011 875.8
2010 876.5
2009 938.3 (Billions of yen)
(FY)
2011 521.9
2010 557.6
2009 502.8 (Billions of yen)
(FY)
2011 413.9
2010 458.5
2009 523.4 (Billions of yen)
(FY)
2011 130.2
2010 123.4
2009 127.0 (Billions of yen)
(FY)