Ricoh 2011 Annual Report Download - page 7
Download and view the complete annual report
Please find page 7 of the 2011 Ricoh annual report below. You can navigate through the pages in the report by either clicking on the pages listed below, or by using the keyword search tool below to find specific information within the annual report.-
 1
1 -
 2
2 -
 3
3 -
 4
4 -
 5
5 -
 6
6 -
 7
7 -
 8
8 -
 9
9 -
 10
10 -
 11
11 -
 12
12 -
 13
13 -
 14
14 -
 15
15 -
 16
16 -
 17
17 -
 18
18 -
19
-
20
-
21
-
22
-
23
-
24
-
25
-
26
-
27
-
28
-
29
-
30
-
31
-
32
-
33
-
34
-
35
-
36
-
37
-
38
 |
 |

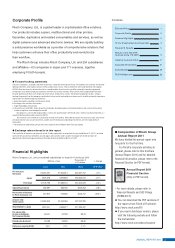
Net sales
Operating margin
Operating income
Return on equity (ROE)
Net income per share
Free cash flow
Net sales declined 0.1 % in
Japan and 6.5% outside of
Japan from the year before.
Total net sales showed a 3.7%
decline from the previous fiscal
year. Excluding the effects of
currency rate fluctuations, net
sales grew 1.9%.
As the yen’s appreciation put
pressure on earnings, operating
margin was reduced by 0.2
percentage point from the
previous fiscal year. Operating
income declined 8.8% to 60.1
billion yen.
Free cash flow, generated
by operating activities and
investment activities, was
a positive 38 billion yen, a
decrease of 63 billion yen from
the previous year.
Net income per share posted a
decline of 11.33 yen to 27.08 yen,
compared to 38.41 yen in the
previous fiscal year.
ROE recorded a 0.8 percentage
point decrease to 2.1% from
2.9% in fiscal 2010.
¥1,942 billion
3.1%
¥60.1 billion
2.1%
¥27.08
¥38 billion
(FY)
(%)
2007 2008 2009 2010 2011
8.4 8.2
3.6 3.3 3.1
(FY)
(Billions of yen)
2011 60.1
174.3
2007
181.5
2008
74.5
2009
65.9
2010
(FY)
(%)
2009
2007
11.0
2008
9.9
0.6
2010
2.9
2011
2.1
(FY)
(Yen)
2011 27.08
153.10
2007
146.04
2008
9.02
2009
38.41
2010
-195.6
101.1
38.0
51.8
-3.9
(FY)
(Billions of yen)
2011
2007
2008
2009
2010
* For more details, please refer to the addendum, “Financial Section.”
1,066.1875.8
Japan Overseas (Billions of yen)
(FY)
2,068.9
2007
2008 2,219.9
2009 2,091.6
2010 2,016.3
1,942.0
2011 AB
AB
Operating income for fiscal 2011 reflects the negative impact of approx. ¥9.4 billion associated with the facilities damage, sales and shipments decrease, and other ramifications of
the Great East Japan Earthquake.
ANNUAL REPORT 2011 6